





Using clinic diarrhoea data to detect campylobacteriosis earlier
Campylobacteriosis is one of Australia’s most frequently notified bacterial gastrointestinal infections. It commonly causes diarrhoea, abdominal pain, fever and, in some cases, vomiting or bloody stools. People often recover without hospital treatment, so laboratory notifications provide an important but delayed view of community transmission. Syndromic surveillance can add an earlier signal by tracking patterns of diarrhoeal illness recorded during ordinary clinical care.
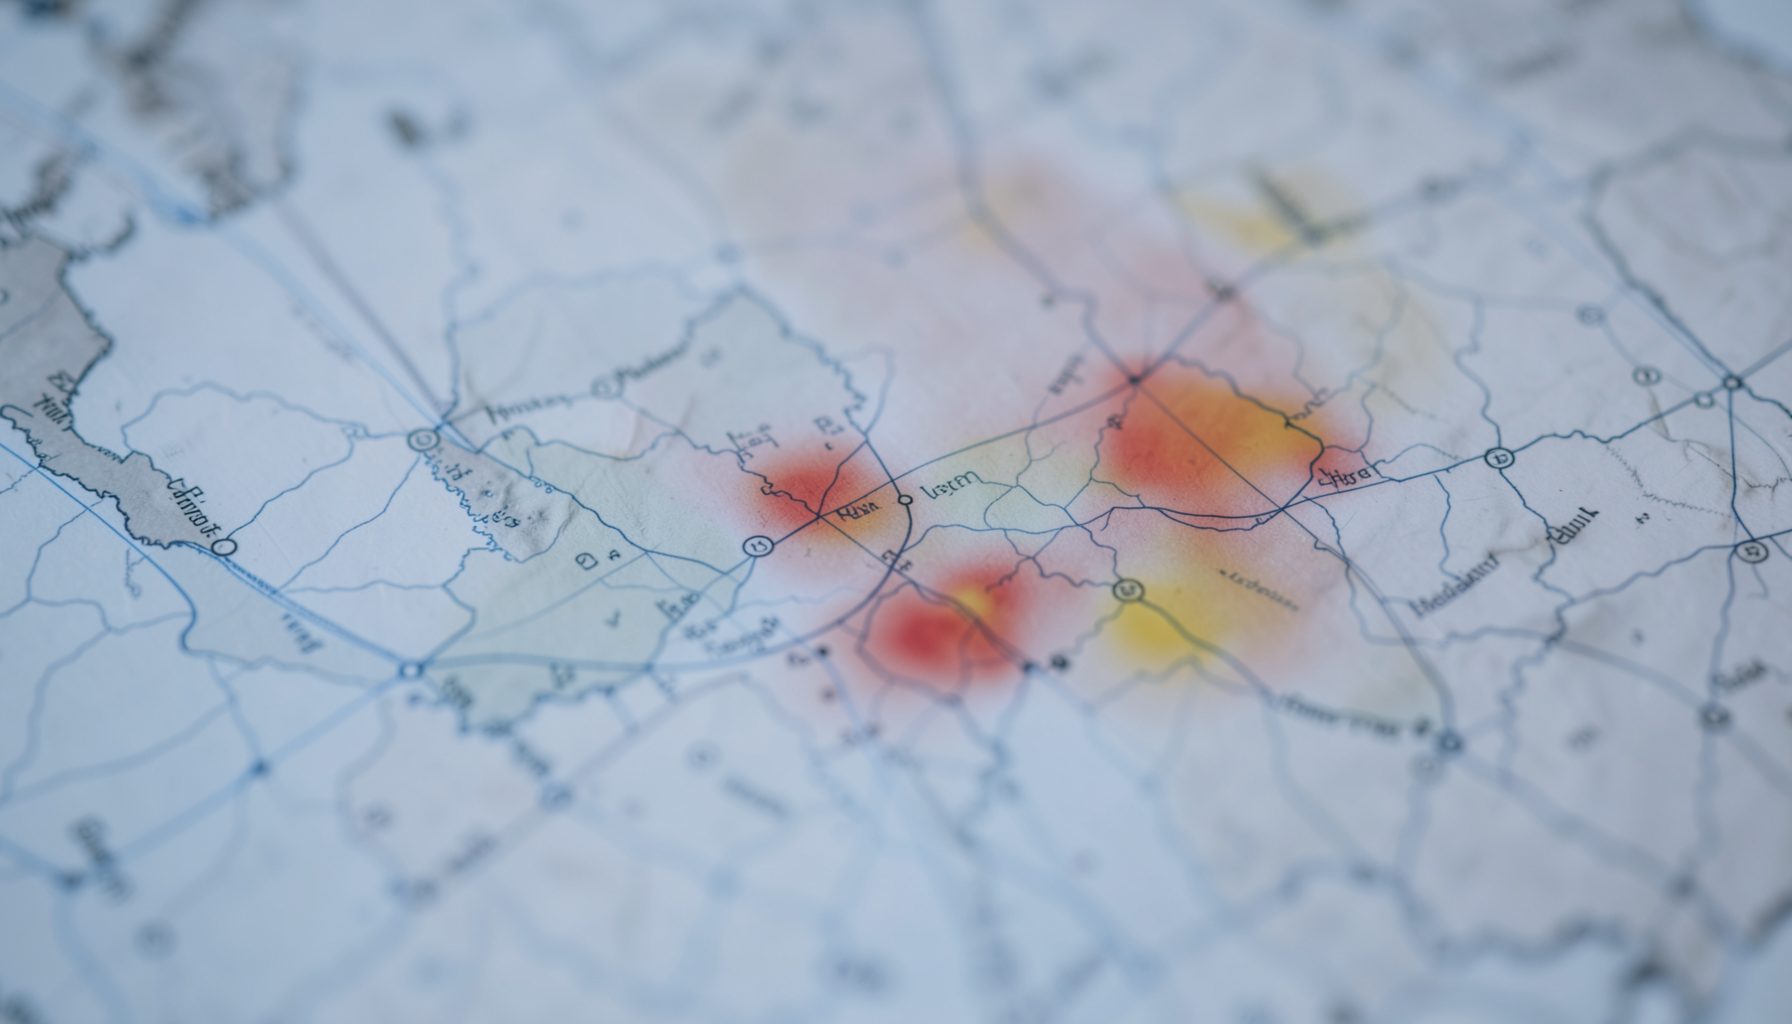
Syndromic surveillance for campylobacteriosis using diarrheal illness data from clinics does not attempt to diagnose every patient from symptoms alone. Instead, it monitors changes in the number, timing, location and characteristics of patients presenting with a relevant syndrome. A sudden rise in acute gastroenteritis consultations may prompt public-health teams to investigate food, water, animal or person-to-person exposures before confirmatory results are complete.
This approach is particularly useful in Australia’s dispersed health system. General practices in Sydney, Melbourne, Brisbane, Perth and regional centres may use different clinical software, while patients can move between GPs, urgent-care clinics, emergency departments and telehealth services. A practical surveillance design must therefore combine comparable indicators with local knowledge and laboratory confirmation.
The strongest results come from combining clinic consultation data with other channels, including pathology, hospital admissions, ambulance activity, pharmacy purchases, schools, aged-care services and environmental investigations. Used carefully, these sources can help distinguish a genuine outbreak from seasonal variation, changes in health-seeking behaviour or a short-lived increase in gastrointestinal illness.
Why diarrhoeal illness is an early warning signal
Campylobacter infections are usually confirmed through stool testing, often with culture or molecular methods. There can be a delay between symptom onset, a patient’s appointment, specimen collection, laboratory processing and notification to public-health authorities. Clinic-based syndromic data may become available sooner because it captures the initial reason for consultation, such as acute diarrhoea, gastroenteritis or abdominal pain with fever.
The signal is valuable because campylobacteriosis has a recognisable clinical pattern, even though it is not specific to Campylobacter. Viral gastroenteritis, Salmonella, Shigella, diarrhoeagenic Escherichia coli, food poisoning without an identified pathogen and non-infectious bowel conditions can produce similar presentations. For that reason, a rise in diarrhoeal consultations should be treated as an alert for investigation rather than proof of a Campylobacter outbreak.
A useful system measures both counts and rates. Ten additional consultations may be concerning in a small rural community but unremarkable in central Melbourne. Analysts can compare current activity with historical baselines for the same week, account for day-of-week effects and examine whether the increase is concentrated in a particular age group, postcode, clinic network or exposure setting.
Building a clinic-based monitoring stream
The first design decision is a clear case definition. A broad definition might include consultations coded for diarrhoea, acute gastroenteritis, enteritis or suspected foodborne illness. A narrower definition could require diarrhoea plus fever, abdominal pain or bloody stool. The broader definition improves sensitivity, while the narrower version may produce a cleaner signal. Running both in parallel can show whether an increase is general or concentrated among patients with more characteristic symptoms.
Data fields should be limited to what is needed for public-health action. Date of consultation, patient age band, broad geographic area, symptom codes, specimen collection and referral status can support timely analysis without requiring unnecessary personal information. Where feasible, the system should distinguish new episodes from follow-up visits, identify telehealth consultations and record whether a patient was referred to hospital.
Data quality needs continuous attention. Coding practices vary between clinicians, clinics and software systems. One practice may record “gastroenteritis,” while another uses “diarrhoea” or a free-text note. Changes to electronic medical record templates, bulk uploads from a new provider or altered reimbursement practices can create artificial jumps. Routine checks for missing fields, duplicate encounters and sudden shifts in coding are essential before interpreting trends.
The most useful reporting rhythm depends on the setting. Daily feeds can support active outbreak investigation, while daily or twice-weekly aggregation may be sufficient for routine monitoring. A dashboard should display recent activity against an expected range, map clusters cautiously and allow analysts to drill down to clinic catchments without exposing identifiable patient information.
Connecting symptoms with laboratory and field evidence
Clinic data becomes more informative when linked to pathology results. Laboratories can provide the proportion of submitted stool specimens that test positive for Campylobacter, the number of specimens received and the distribution of other pathogens. If diarrhoeal consultations rise at the same time as Campylobacter detections, confidence in a genuine increase grows. If consultations rise but positivity remains stable, analysts may be seeing a viral illness, a change in testing behaviour or improved access to care.
This linkage should preserve the distinction between syndromic and confirmed surveillance. A patient may have campylobacteriosis but never submit a specimen, while another may submit a specimen after symptoms have eased. Test ordering is influenced by age, severity, clinician preference, travel history and access to bulk-billing or pathology services. These factors can bias comparisons between regions and between time periods.
Geographic and temporal investigation can then guide fieldwork. A cluster of consultations in western Sydney might lead to questions about a shared restaurant, household transmission, a childcare centre or contaminated food distributed through a local market. In Queensland, a rise after heavy rainfall may warrant attention to private water supplies or recreational exposure, although rainfall alone cannot establish a cause. Interviews, food-chain tracing and environmental sampling remain necessary.
A multi-channel model provides useful context. Pharmacy purchasing trends can reveal changes in gastrointestinal symptom treatment or help identify population activity outside participating clinics, while the broader value of pharmacy data for outbreak detection is explained in this pharmacy surveillance resource. Schools and aged-care facilities can supply absenteeism or illness reports, and emergency departments can show whether the apparent increase is producing severe disease.
Australian settings that shape interpretation
Australian surveillance must account for substantial differences in access and geography. A city-based clinic network may capture large volumes from Sydney or Melbourne but miss people in remote Western Australia, the Northern Territory or far-north Queensland. Patients in regional areas may travel long distances to a hospital, use an Aboriginal Community Controlled Health Service or delay care because of cost, transport and work responsibilities. A low clinic signal does not necessarily mean low transmission.
Everyday food practices also matter. Barbecues, shared meals, takeaway food and preparation of raw chicken can create opportunities for Campylobacter exposure when kitchen surfaces, utensils or hands are contaminated. Poultry is widely available through Australian supermarkets, independent butchers and food-service businesses, and raw chicken juices can spread easily if preparation areas are not cleaned. These habits are relevant when a clinic signal appears in several households connected to a common event.
The regulatory context is shared across jurisdictions but operationally decentralised. Campylobacteriosis is a notifiable condition in Australian public-health systems, with reporting and investigation processes managed under state and territory legislation. The Biosecurity Act 2015 also supports national action on risks affecting people, animals and the environment, while the National Notifiable Diseases Surveillance System helps compile nationally comparable notifications. A clinic alert should therefore feed into the appropriate state or territory public-health unit rather than bypass established reporting pathways.
Privacy and governance are equally important. Data-sharing agreements should define permitted uses, retention periods, access controls and responsibilities for responding to an alert. Small-area maps can unintentionally identify households or small communities, particularly in rural Australia. Suppression, aggregation and secure analyst access protect public trust while preserving the operational value of surveillance.
Turning an alert into a public-health response
An alert threshold should be calibrated before an outbreak occurs. Possible triggers include a statistically unusual increase above the expected weekly range, a sustained rise across several clinics, a cluster among patients linked to one institution or a simultaneous increase in diarrhoea consultations and Campylobacter-positive specimens. Thresholds should be reviewed after each investigation because seasonal patterns, population movement and changes in testing can alter the baseline.
The first response is usually validation. Public-health staff can contact participating clinics to confirm whether coding, staffing, opening hours or software changes explain the increase. They can review laboratory turnaround times, check hospital and emergency presentations, and compare activity with school absenteeism or aged-care reports. This prevents scarce field resources from being directed at a data artefact.
If the signal persists, investigators can conduct targeted interviews and request stool specimens from suitable patients. Questions should cover meals, poultry handling, untreated water, animal contact, travel, childcare attendance, social events and links to food businesses. Campylobacter outbreaks may involve sporadic exposures rather than a single obvious source, so analytical epidemiology and food-chain investigation may be required.
The response should also include proportionate communication. Clinicians may receive a reminder about testing and notification, while the public may need practical advice on hand hygiene, safe poultry preparation and when to seek medical attention. Messages should avoid implying that every case is linked to the suspected source until laboratory and epidemiological evidence supports that conclusion.
Measuring performance and strengthening the system
A clinic surveillance programme should be evaluated against clear public-health outcomes. Useful measures include timeliness from consultation to alert, completeness of participating clinics, proportion of alerts validated, sensitivity for known outbreaks and the number of investigations that produce actionable findings. Analysts should also assess whether alerts lead to faster testing, earlier control measures or better identification of common exposures.
Representativeness deserves specific attention. A system built mostly from metropolitan general practices may undercount people who use hospitals, community-controlled services, walk-in centres or no formal healthcare. Participation from rural and remote providers, culturally appropriate engagement and support for interoperable reporting can improve coverage. Telehealth records should be analysed separately where symptom detail is less complete.
Examples from other syndromic programmes can inform governance, alert design and evaluation; the available surveillance case studies illustrate how different data streams can support earlier recognition of health threats. Lessons should be adapted to Australian clinical workflows rather than copied without testing. A measure that works during a major international event may need different thresholds in a regional community or during the winter respiratory season.
Gastrointestinal surveillance can also reveal complications beyond diarrhoea. Dehydration and kidney injury may lead to emergency care, especially among older adults, young children and people with existing illness. Linking gastrointestinal activity with indicators of acute kidney injury can help assess severity, an approach discussed in infectious disease kidney monitoring. This does not replace clinical assessment, but it adds a valuable perspective on the burden of an outbreak.
Practical recommendations for implementation
Begin with a small, testable network of clinics and expand after the signal has been assessed against laboratory and notification data. The following measures can improve reliability:
- Use a shared syndrome definition with separate broad and specific indicators for diarrhoea and acute gastroenteritis.
- Compare current counts with seasonal, weekday-adjusted baselines and population-adjusted rates.
- Link consultation trends with stool testing, hospital activity, school absenteeism and aged-care reports.
- Establish privacy safeguards, data-quality checks and a documented process for validating alerts.
- Evaluate every investigation for timeliness, representativeness, false alarms and public-health action.
A successful programme should make the next decision easier: whether to request more specimens, interview affected patients, inspect a food venue, issue clinical advice or continue routine monitoring. Its value lies in shortening the interval between the first unusual pattern and a targeted response, while retaining laboratory confirmation as the standard for diagnosis.
Health departments, clinic networks, laboratories and community providers can begin by agreeing on a practical data specification, testing it across metropolitan and regional settings, and reviewing performance through real investigations. With careful governance and local calibration, diarrhoeal illness data can become an efficient early-warning layer for Campylobacter and other enteric threats across Australia.