





Ambulance call volume spikes and severe influenza surveillance
When influenza activity intensifies, the earliest warning may come from a change in how often people seek urgent help rather than from a laboratory result. A sudden increase in ambulance calls can reveal that respiratory illness is becoming more severe, spreading through vulnerable communities, or overwhelming primary-care access. This makes emergency transport data a valuable syndromic indicator for public-health monitoring.
Ambulance dispatch records are generated close to the time of symptom onset or clinical deterioration. They can therefore complement sentinel-clinic reports, hospital admissions, pharmacy purchases, school absenteeism, and laboratory surveillance. The signal is especially useful when testing capacity is limited, reporting is delayed, or people with serious breathing problems bypass outpatient services.
Call volume alone does not diagnose influenza. It reflects demand for emergency assistance and may be affected by weather, holidays, accidents, healthcare access, public anxiety, and changes in dispatch practice. Its value comes from interpreting several indicators together, using consistent definitions and geographic comparisons.
Why emergency transport data can signal influenza severity
Seasonal influenza usually begins with fever, cough, sore throat, fatigue, and muscle aches. Most people recover without emergency treatment, but severe infection can cause pneumonia, hypoxia, dehydration, altered consciousness, or worsening of chronic heart and lung disease. When these complications become more common, families and care facilities may request an ambulance rather than arrange routine transport.
A rise in ambulance calls can therefore indicate a shift in the burden of illness. The most informative pattern is often not a small increase in all calls, but an unusual concentration of respiratory complaints, fever-related emergencies, or transfers involving older adults and people with underlying conditions. A growing share of calls that result in hospital transport may provide additional evidence of increasing severity.
Timing also matters. Ambulance activity may increase before hospitals report a clear rise in influenza admissions because emergency calls occur at the point when symptoms become unmanageable. Conversely, transport data may remain elevated after transmission has peaked, as complications and delayed care continue to produce admissions. Analysts should treat the measure as an early warning signal, not a real-time count of new infections.
Building a reliable ambulance-based signal
A surveillance team first needs a stable case definition. Depending on the dispatch system, relevant records might include suspected respiratory distress, difficulty breathing, high fever, influenza-like illness, altered consciousness associated with fever, or emergency transfers from residential-care settings. Definitions should be documented so that a change in coding does not appear as a false outbreak.
Raw call counts are rarely sufficient. Analysts can calculate calls per 100,000 residents, compare the current figure with a multi-year seasonal baseline, and examine the percentage change from recent weeks. A seven-day moving average helps reduce the effect of individual weekends, while age-specific rates can show whether a rise is concentrated among children, working-age adults, or older people.
Dispatch location and destination add useful context. A cluster of calls in several neighboring municipalities may suggest community transmission, while a rise around one hospital may reflect diversion, bed shortages, or a temporary access problem. The interval between the call and hospital arrival can also be monitored because longer transport times may signal system strain rather than a change in disease severity.
Classification quality improves when structured dispatch codes are combined with free-text descriptions, ambulance crew observations, and hospital diagnosis data. Researchers examining ambulance dispatch codes can distinguish broad respiratory distress patterns from more specific operational categories, helping public-health teams decide which fields are suitable for automated alerts.
Separating influenza from other causes of respiratory distress
Influenza is only one explanation for a surge in emergency respiratory calls. Respiratory syncytial virus, COVID-19, bacterial pneumonia, asthma exacerbations, chronic obstructive pulmonary disease, heat or cold exposure, and air pollution can produce similar symptoms. A surveillance system must avoid treating every respiratory spike as influenza activity.
The best approach is triangulation. Ambulance data can be compared with influenza-like illness reports from clinics, emergency-department syndromes, antiviral prescriptions, school absenteeism, nursing-home outbreaks, and laboratory positivity. If several channels rise within a plausible time window, confidence in a shared infectious cause increases. If ambulance calls rise while respiratory testing and clinic consultations remain stable, operational or environmental explanations deserve closer review.
Geographic and age patterns are also informative. Influenza may first produce absenteeism among school-age children, followed by illness in parents and then severe outcomes among older adults. A simultaneous increase in respiratory calls from elderly-care facilities and hospital admissions for pneumonia suggests a different level of concern than a short-lived rise among younger adults after a sporting event.
Other syndromic categories can reveal competing explanations. For example, emergency-department monitoring for gastrointestinal complaints can help identify whether a regional increase is part of a broader foodborne illness signal rather than a respiratory outbreak. Cross-checking multiple symptom groups reduces the chance that analysts attach an influenza label to an unrelated event.
Interpreting the signal across Japan’s monitoring network
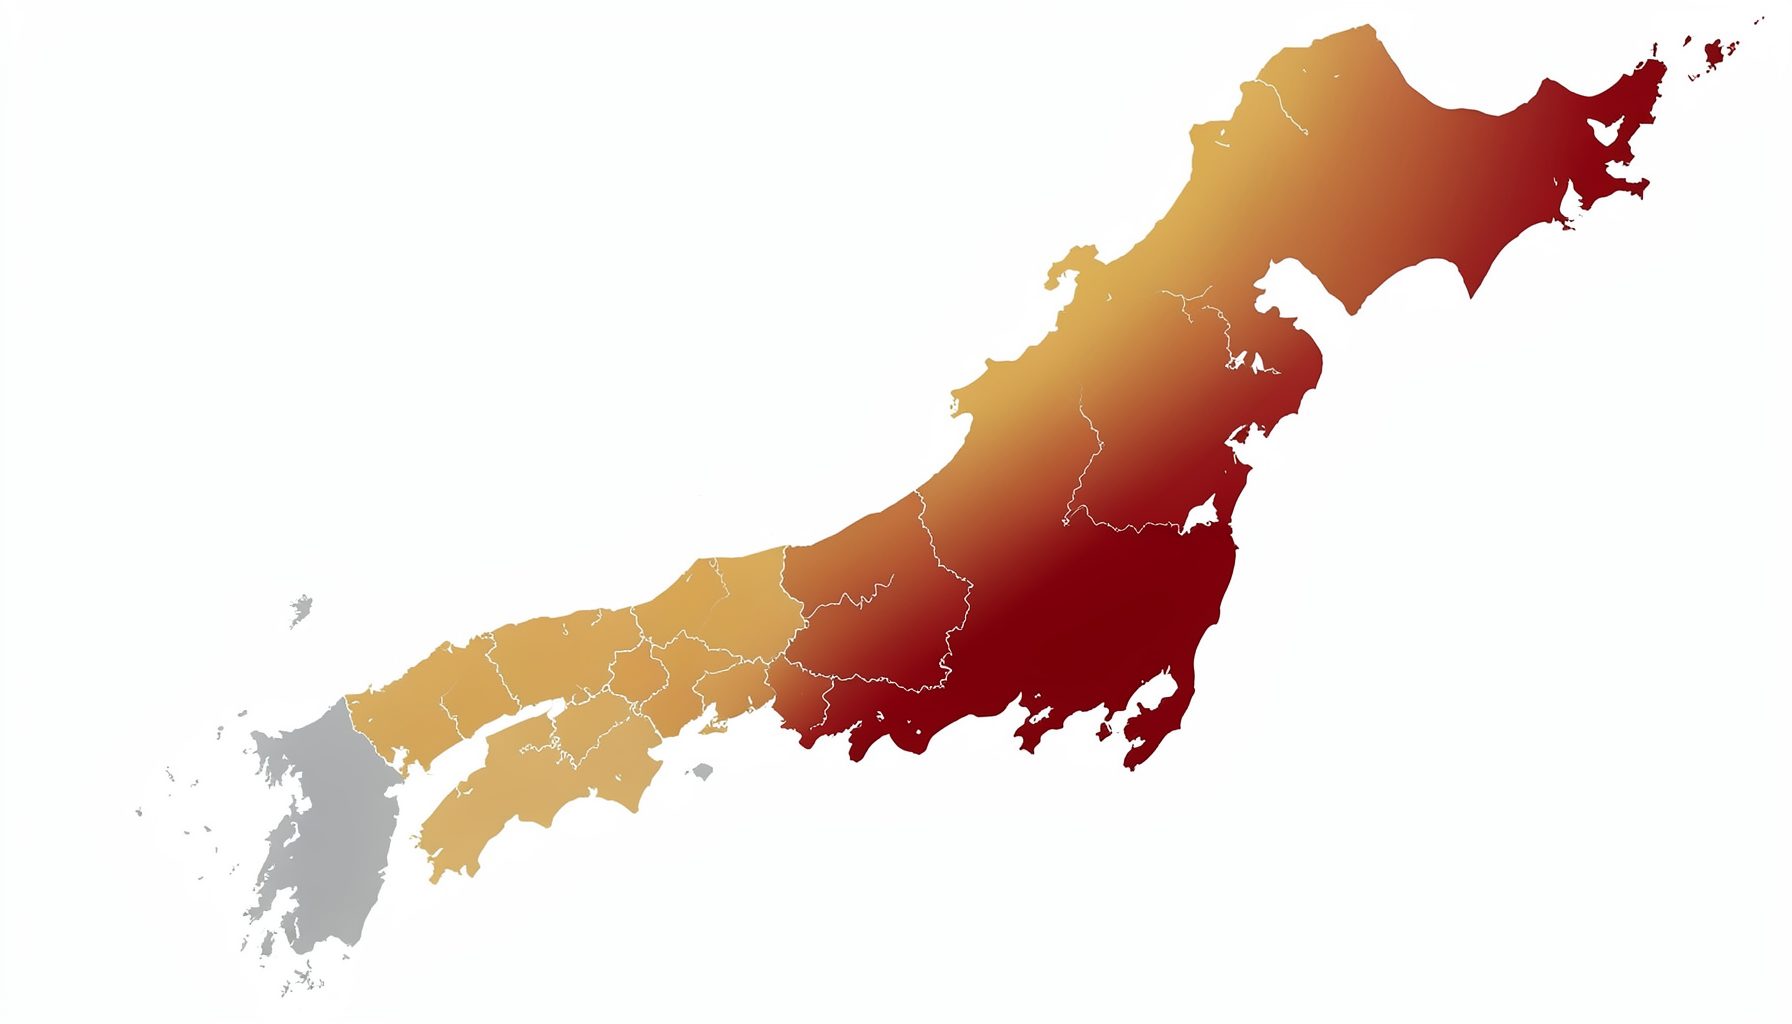
Japan’s public-health surveillance environment offers multiple channels for assessing unusual illness activity. Information from clinics and hospitals can be reviewed alongside ambulance movements, pharmacy activity, school absenteeism, elderly-care reports, and laboratory confirmation. Each source captures a different stage of the illness pathway, from community symptoms to healthcare use and severe outcomes.
School absenteeism may provide an early view of transmission among children, while pharmacy surveillance can reflect demand for medications and changes in community healthcare behavior. Ambulance calls sit closer to the severe end of the spectrum. When these sources are linked by time and location, officials can identify whether influenza is spreading widely, producing severe disease, or creating pressure on emergency services.
During major international events, enhanced monitoring may be needed because visitors, crowded venues, altered travel patterns, and temporary healthcare demand can change the baseline. An increase in ambulance calls near an event site should be assessed against attendance, weather, transport disruptions, and noninfectious injuries. The same data can still support rapid detection when paired with symptom information and hospital outcomes.
Data governance is essential. Records should be analyzed in aggregated form whenever possible, with safeguards for personal information. Clear access rules, standardized coding, quality checks, and secure data exchange allow health authorities to act quickly without compromising confidentiality. A fast signal is useful only when decision-makers trust its meaning and its limitations.
What ambulance spikes can tell decision-makers
The operational value of an ambulance signal lies in the speed of the response it enables. A sustained rise in respiratory emergency calls may prompt hospitals to review staffing, oxygen supplies, isolation capacity, ambulance destinations, and discharge planning. Public-health authorities may intensify testing, communicate warning signs, or coordinate support for nursing homes and home-care services.
The signal can also help identify inequities. If call rates rise sharply in areas with fewer clinics, longer travel times, or older populations, the increase may reflect barriers to early treatment as well as infection prevalence. Comparing municipalities by population, age structure, healthcare capacity, and socioeconomic conditions produces a fairer interpretation than ranking them by raw volume.
Analysts should define alert thresholds before the influenza season begins. A threshold might combine a percentage increase above baseline, a minimum number of consecutive days, and corroboration from another surveillance channel. Escalation rules can specify who reviews the alert, which partners are notified, and what additional data are collected.
The following framework helps place ambulance activity alongside other indicators:
| Signal | What it captures | Main strength | Important limitation |
|---|---|---|---|
| Ambulance respiratory calls | Urgent community demand | Rapid view of severe or worsening illness | Influenced by access, dispatch behavior, and noninfectious causes |
| Hospital admissions | Serious outcomes requiring inpatient care | Direct measure of healthcare burden | Often delayed and affected by bed availability |
| Clinic influenza-like illness | Community consultations | Useful for tracking broader transmission | Misses people who do not seek care |
| Pharmacy activity | Medication-seeking behavior | Can show changes outside hospitals | Product availability and prescribing habits affect results |
| School absenteeism | Illness-related absence among children | Often sensitive to early spread | Absence policies and non-infectious causes vary |
| Laboratory positivity | Confirmed pathogen detection | Supports attribution to influenza | Testing volume and turnaround time can distort trends |
No single channel should control the interpretation. A modest ambulance increase accompanied by rising laboratory positivity and school absenteeism may deserve attention even if hospital admissions have not yet changed. Conversely, a dramatic call spike without corroborating respiratory evidence may require an operational investigation before it is presented as an influenza warning.
Turning early warning into timely action
Once an unusual pattern is detected, public-health teams need a short validation process. They can check dispatch narratives, sample records for coding consistency, review hospital destinations, compare neighboring jurisdictions, and ask whether a software or policy change occurred. Weather records, air-quality measurements, public events, and ambulance availability should be included in that review.
Clinical severity should be monitored separately from transmission. Useful follow-up measures include oxygen requirement, intensive-care admission, pneumonia diagnosis, deaths, duration of hospitalization, and the proportion of calls involving older adults or care facilities. This distinction prevents a high volume of mild illness from being confused with a high case-fatality risk.
Communication should be specific and proportionate. An alert can state that emergency respiratory demand is above the expected seasonal range, explain what evidence supports the finding, and identify what remains uncertain. Hospitals may need operational guidance, while the public may need information about vaccination, warning signs, when to contact a clinic, and when emergency services are appropriate.
Recommendations for using the indicator effectively:
- Establish age-specific and area-specific seasonal baselines before influenza activity rises.
- Combine ambulance call volume with respiratory dispatch codes, hospital outcomes, and laboratory positivity.
- Track both the number of calls and the proportion resulting in hospital transport or advanced care.
- Investigate changes in dispatch policy, ambulance availability, weather, pollution, and major events.
- Set predefined alert and escalation thresholds with named responsibilities across agencies.
Ambulance surveillance is most powerful when it becomes part of a feedback loop. An alert leads to validation, validation leads to targeted action, and subsequent data show whether emergency demand, severe outcomes, and transmission indicators are changing. This approach supports resource allocation without waiting for every laboratory result to arrive.
Public-health organizations can strengthen preparedness by mapping their existing ambulance, hospital, pharmacy, school, care-facility, and laboratory data streams before the next influenza season. Review the definitions, baselines, privacy controls, and escalation procedures now, then use real-time monitoring to detect unusual respiratory demand and coordinate a faster, evidence-based response.