





Detecting Foodborne Illness Signals in Emergency Departments
Syndromic surveillance for foodborne illness signals in emergency departments can reveal unusual disease activity before laboratory confirmation is available. Patients may arrive with vomiting, diarrhea, abdominal pain, fever, dehydration, or neurological symptoms, and these complaints can be analyzed as early indicators of a possible outbreak.
Emergency departments are valuable observation points because they receive patients from many neighborhoods, workplaces, schools, care facilities, and travel settings. A sudden increase in gastrointestinal complaints, changes in patient age profiles, or several visits linked to the same location may signal a common exposure that routine reporting has not yet identified.
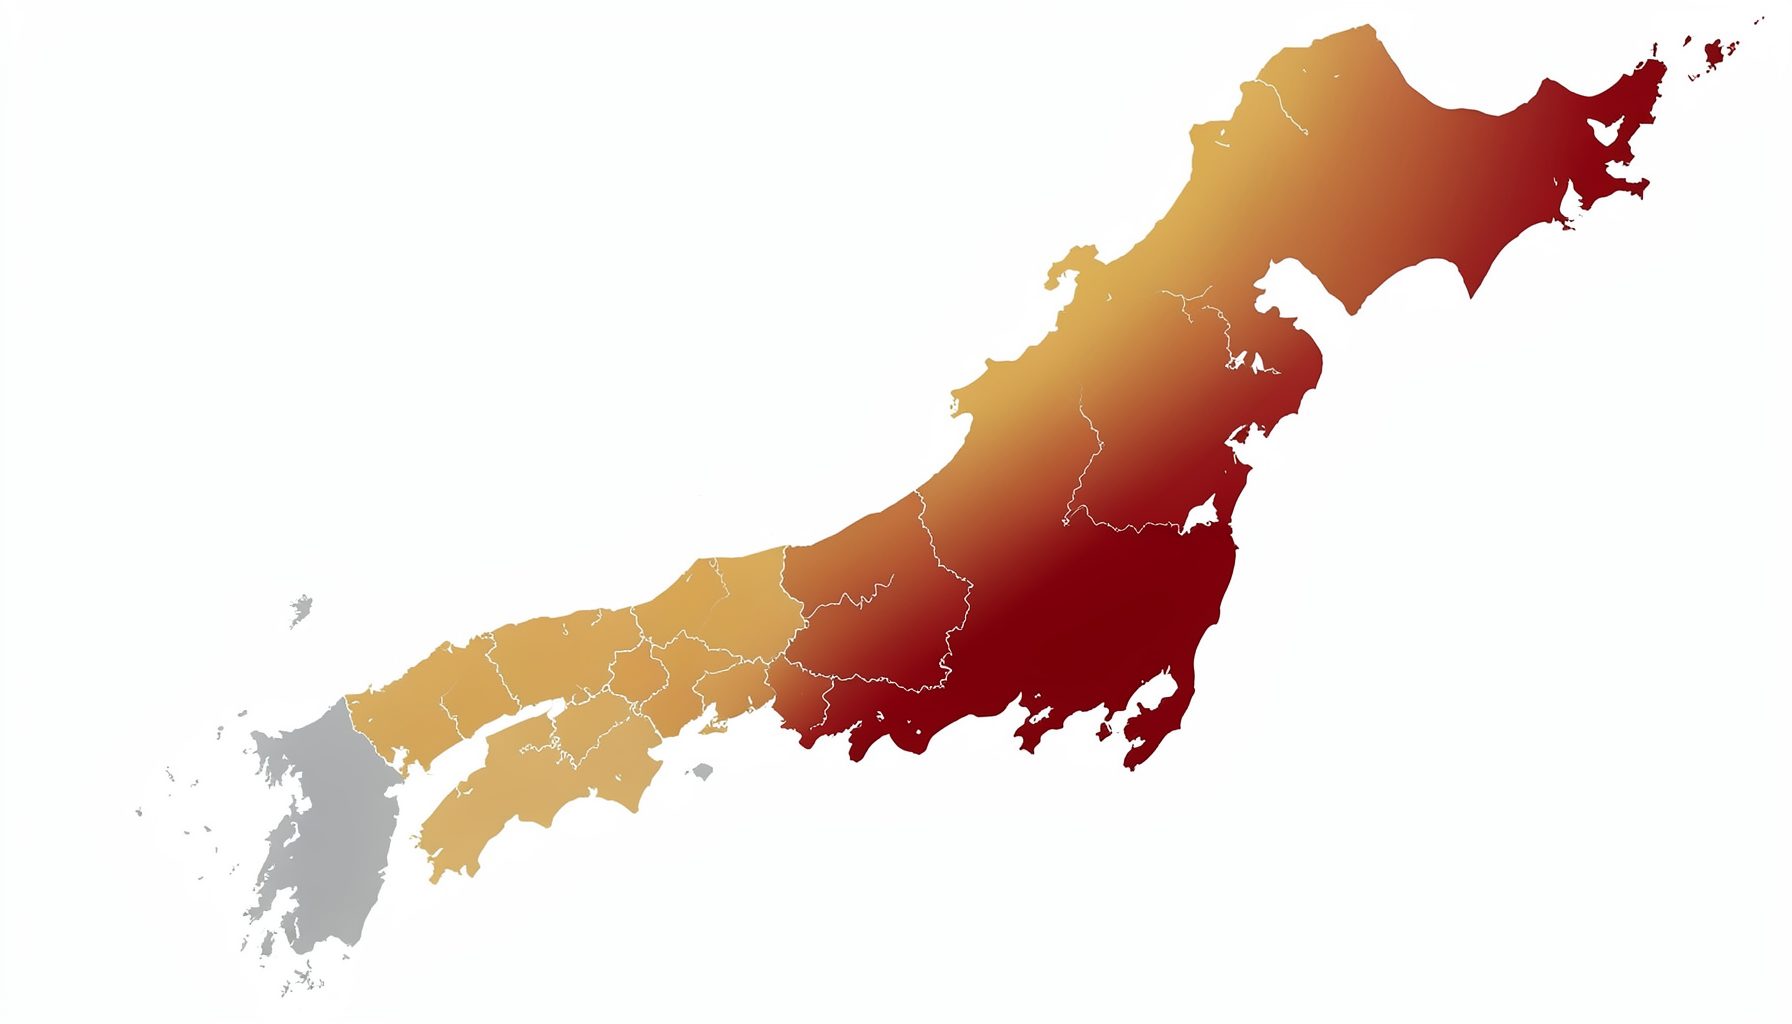
The strongest early-warning systems combine clinical information with other public-health channels. In Japan, data from hospitals, clinics, ambulances, pharmacies, schools, elderly-care facilities, and laboratories can be viewed together to support faster epidemiological assessment and response.
Why Emergency Departments Matter
Emergency departments operate continuously and often see people who have not yet received a formal diagnosis. This makes them useful for detecting clusters based on symptoms rather than confirmed pathogens. A patient may present with acute gastroenteritis, while the underlying cause remains unknown for several days.
The timing of visits can be especially informative. A sharp rise in gastrointestinal cases over a short period may indicate exposure to contaminated food or water. When several patients arrive from the same workplace, school, hotel, restaurant district, or event venue, the pattern becomes more meaningful than any individual visit.
Emergency department data also capture severe cases that may be missed by community surveys. Foodborne illness can lead to dehydration, kidney complications, sepsis, or neurological symptoms requiring urgent care. Monitoring these encounters helps public-health teams estimate the seriousness of an event while they investigate its source.
Recognizing Foodborne Illness Patterns
A useful surveillance system tracks a broad syndrome definition rather than relying on a single diagnostic code. Acute diarrhea, nausea, vomiting, abdominal cramps, fever, bloody stool, and dehydration may be grouped into gastrointestinal indicators. Additional categories can identify suspected toxin-mediated illness or unusual neurological presentations.
Signals become stronger when several dimensions change at the same time. These include the number of visits, the percentage of emergency patients with gastrointestinal symptoms, geographic concentration, age distribution, and the interval between symptom onset and hospital attendance. A rise among previously healthy adults after a shared gathering may require a different investigation from persistent diarrhea among residents of a long-term-care facility.
Data quality also affects interpretation. Coding practices, triage terminology, holiday schedules, weather, seasonal viruses, and changes in emergency department capacity can all influence apparent case volume. Analysts should compare current activity with historical baselines and assess whether the increase exceeds expected variation.
Comparing Early Signals Across Channels
No single stream can establish that contaminated food caused an illness cluster. The purpose of syndromic monitoring is to identify an unusual pattern that deserves verification through interviews, specimen collection, inspections, and laboratory testing.
| Surveillance channel | Early signal for foodborne illness | Useful strength | Important limitation |
|---|---|---|---|
| Emergency departments | Increase in vomiting, diarrhea, abdominal pain, or dehydration | Captures urgent and severe cases quickly | May overrepresent serious illness and local access patterns |
| Ambulance services | Multiple transports with acute gastrointestinal or neurological symptoms | Identifies severe clusters and rapid deterioration | Limited clinical detail before hospital assessment |
| Clinics | Rise in mild gastrointestinal consultations | Broad community coverage | Reporting speed and participation may vary |
| Pharmacies | Increased purchases or consultations involving antidiarrheal or rehydration products | Can indicate community illness before hospital attendance | Medication use is not specific to infection |
| Schools | Absenteeism linked to vomiting, diarrhea, or fever | Highlights child-centered clusters and shared exposures | Absence reasons may be incomplete or delayed |
| Laboratories | Confirmed pathogens and antimicrobial or toxin findings | Supports diagnosis and source investigation | Results may arrive after transmission has expanded |
| Elderly-care facilities | Concentrated illness among residents or staff | Detects high-risk institutional outbreaks | Small populations can produce unstable rates |
Cross-channel comparison helps distinguish a genuine outbreak from a temporary change in emergency department behavior. For example, a rise in hospital visits supported by school absenteeism and pharmacy activity is more persuasive than an isolated increase in one facility.
Turning Data Into Public-Health Action
The value of an alert depends on how quickly and responsibly it leads to investigation. Analysts can review case counts by hour, day, facility, municipality, age group, and symptom combination. They can also examine whether visits cluster after a particular meal period or follow attendance at a common event.
Thresholds should be flexible enough to detect unusual activity without generating excessive false alarms. A statistical alert might identify a deviation from a seven-day or seasonal baseline, while a rule-based alert could flag several patients from the same institution within a defined period. Analysts should record the rationale for each alert and document how it was resolved.
Clear governance is essential when health information moves between clinical settings and public-health agencies. Information about permitted uses, analytical responsibilities, privacy safeguards, and reporting procedures should be established before an incident occurs. Resources on using surveillance data can help organizations frame these decisions around appropriate interpretation and responsible action.
Linking Emergency Data With Community Signals
Foodborne illness often begins outside the hospital, so emergency department monitoring should be connected to community-level observations. Pharmacy surveillance may show increased demand for oral rehydration products, gastrointestinal medicines, or consultations for acute digestive symptoms. These changes can appear before patients require emergency care and may help identify the early geographic footprint of an event.
School absenteeism is another useful indicator. A cluster of absences due to vomiting or diarrhea can point to a shared meal, contaminated water, or person-to-person transmission. Elderly-care facilities may provide an even earlier warning of severe consequences because residents are more vulnerable to dehydration and complications.
Ambulance records add information about severity and location, while laboratory data help classify the cause once specimens are tested. A coordinated system can therefore connect an initial emergency department alert with field epidemiology, food-safety inspection, and clinical guidance. Information about pharmacy surveillance provides additional context for interpreting medicine-related community trends.
Designing Reliable Emergency Department Monitoring
A practical program begins with a small set of clearly defined indicators. These may include acute gastroenteritis visits, bloody diarrhea, vomiting with dehydration, suspected food poisoning, and gastrointestinal illness among patients linked to the same institution. Definitions should remain stable long enough to support comparison, while allowing new indicators to be added when an emerging threat is suspected.
Data should be available at a useful level of timeliness and detail. Daily reporting may be sufficient for gradual seasonal changes, but an event involving a mass gathering may require several updates per day. Location information should support cluster detection without exposing unnecessary personal details, and data access should follow established security controls.
Human review remains important. Automated algorithms can identify departures from baseline, but experienced epidemiologists must consider competing explanations such as norovirus season, extreme heat, public holidays, staffing changes, or a local media report. An alert is a prompt for assessment, not proof of a foodborne outbreak.
Operational Priorities For Faster Response
Public-health teams can improve the usefulness of emergency department signals by connecting surveillance design with practical response procedures:
- Define gastrointestinal and foodborne illness syndromes consistently across participating emergency departments.
- Establish baseline counts by season, day of week, facility, age group, and geographic area.
- Combine symptom data with ambulance, pharmacy, school, care-facility, and laboratory information.
- Create an escalation pathway for interviewing patients, collecting specimens, and inspecting suspected food premises.
- Review false alarms and missed events regularly to refine thresholds and reporting quality.
Training should cover both clinical data entry and epidemiological interpretation. Triage staff and coding teams need clear guidance on symptom categories, while analysts need context about changes in hospital operations. Regular exercises can test whether an alert reaches the right people and whether investigators can obtain the information required to act.
Communication should be proportionate to the evidence. Early internal alerts may describe an unusual gastrointestinal signal without naming a pathogen or suspected venue. Public messages should be based on verified findings and should provide practical advice without causing unnecessary alarm.
Moving From Signal To Response
Emergency department surveillance gives health authorities a faster view of illness activity, particularly when laboratory results and formal case reports are delayed. Its greatest value comes from integration: a hospital signal gains meaning when it aligns with pharmacy purchases, school absences, ambulance transports, care-facility reports, and laboratory findings.
The next step is to make these connections routine before an outbreak occurs. Public-health organizations, hospitals, local authorities, and participating community services can establish data-sharing arrangements, test alert thresholds, and clarify investigation responsibilities through the contact page. Early preparation allows an unusual cluster to move quickly from detection to verification, source control, clinical support, and protection of the wider community.