





Evaluating New Data Streams for Syndromic Surveillance
Syndromic surveillance uses health-related information collected before a diagnosis is confirmed to identify unusual patterns. A rise in fever-related consultations, respiratory symptoms, medication purchases, emergency calls, or school absences may signal an emerging outbreak while laboratory results are still pending. That speed makes the approach valuable, but every new data source must be assessed carefully before it influences public-health decisions.
A data stream can appear promising and still produce misleading alerts. It may cover only part of the population, change when people seek care, depend on unstable reporting systems, or reflect seasonal behavior rather than infection. An effective evaluation framework therefore examines usefulness, reliability, interpretability, governance, and operational value together.
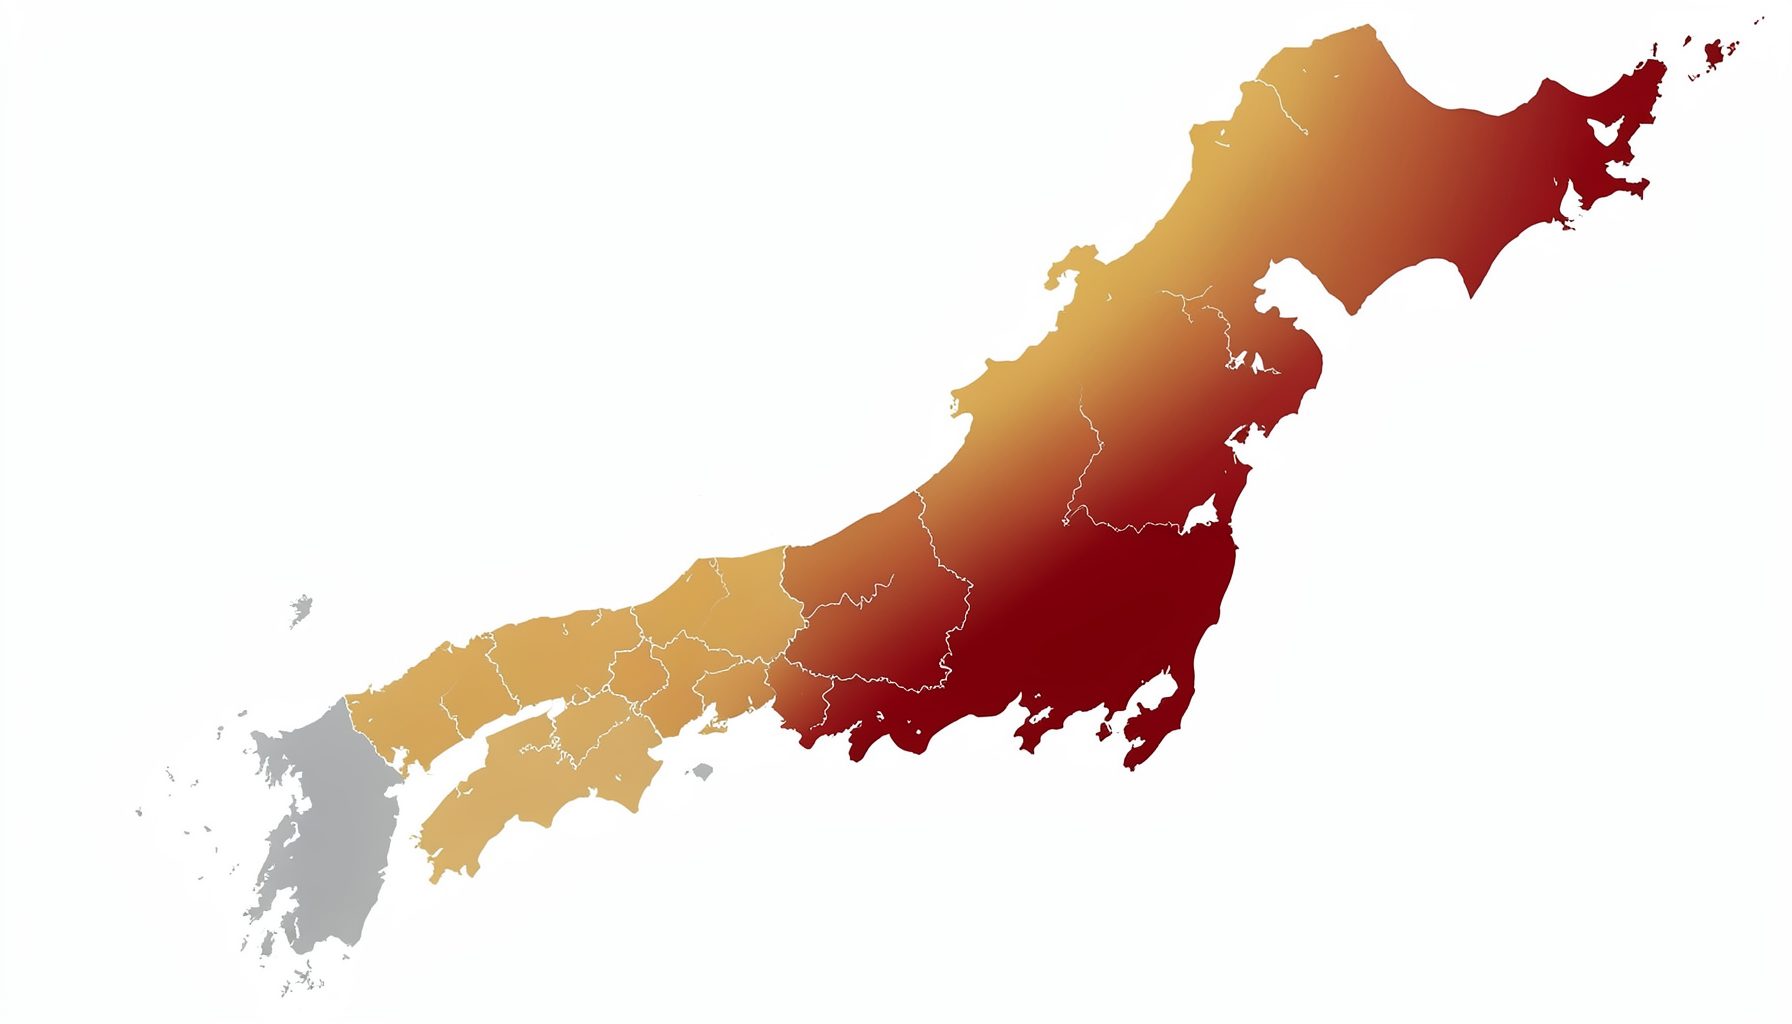
Japan’s multi-channel model provides a practical setting for this work. Information from clinics, hospitals, ambulances, pharmacies, schools, elderly-care facilities, and laboratory testing can be compared to build a broader picture of community health. The same principles apply when public-health agencies consider mobility data, telehealth records, workplace absence, wastewater measurements, or other emerging sources.
Define the decision the data must support
Evaluation should begin with a specific public-health decision rather than with the availability of an interesting dataset. A stream intended to detect influenza-like illness may require different characteristics from one used to identify foodborne disease, heat-related illness, or a possible deliberate biological release. The relevant questions include how early a signal is needed, which population is under observation, and what action would follow an alert.
A useful data source should have a defined surveillance role. It might support broad situational awareness, trigger field investigation, help estimate geographic spread, or provide reassurance when other systems show no unusual activity. These roles should be documented before testing begins, because a source that is valuable for trend monitoring may be unsuitable for issuing case-specific warnings.
The evaluation should also identify the baseline against which the stream will be judged. Existing emergency department reports, laboratory notifications, school absenteeism, pharmacy purchases, and ambulance dispatch records may provide established reference points. A new stream does not need to replace these channels to be useful; it may add speed, reach, or information about groups that are poorly represented elsewhere.
Examine signal quality and population coverage
The first technical assessment concerns what the data actually represent. Coverage includes the number of participating facilities, the regions served, the age groups observed, and the proportion of relevant encounters captured. A pharmacy signal may reflect people who self-treat rather than seek clinical care, while hospital data may overrepresent severe illness. Neither is inherently better, but each requires a clear interpretation.
Timeliness should be measured from the underlying event to its availability for analysis. A stream that arrives quickly but contains frequent revisions may be less useful than one that arrives a day later with stable values. Evaluation should record reporting delays, missing submissions, backfilled records, changes in coding practice, and interruptions caused by maintenance or staffing shortages.
Specificity and sensitivity must be considered together. Broad symptom categories can identify unexpected threats, yet they may generate many false positives during ordinary seasonal variation. Narrow clinical definitions may reduce noise but miss unfamiliar presentations. Testing should compare candidate indicators with confirmed cases, syndromic baselines, and known seasonal patterns rather than relying on a single performance measure.
Pharmacy surveillance illustrates this balance. Purchases of antipyretics, cough remedies, or gastrointestinal products may rise before formal diagnoses are recorded, but sales can also respond to advertising, stockpiling, weather, or changes in access to care. Guidance on pharmacy surveillance resources can help clarify what these observations can support and where interpretation requires caution.
Compare streams with a common evaluation model
A consistent scoring model makes it easier to compare sources that were created for different purposes. Each stream can be assessed against the same dimensions while retaining its specific context. Quantitative measures, expert review, and operational exercises should be combined so that technical performance does not obscure practical limitations.
The following framework can be adapted to local surveillance priorities. Scores should be supported by evidence, recorded with the date and conditions of assessment, and revisited whenever the data-generating process changes.
| Evaluation dimension | Questions to examine | Useful measures or evidence |
|---|---|---|
| Timeliness | How quickly does information become available after the event? | Median reporting delay, revision time, alert lead time |
| Coverage | Which people, places, and care settings are represented? | Facility participation, geographic reach, demographic distribution |
| Signal quality | Does the indicator reflect the health event of interest? | Sensitivity, specificity, positive predictive value, stability |
| Completeness | How often are records missing or delayed? | Missingness rate, submission consistency, backfill frequency |
| Interpretability | Can analysts explain changes in the signal? | Coding clarity, metadata, seasonal adjustment, known confounders |
| Interoperability | Can the stream connect with existing systems? | Common formats, identifiers, linkage success, processing effort |
| Resilience | Does the source remain usable during disruption? | Outage history, backup procedures, performance under surge |
| Actionability | Does the information change a decision or response? | Investigation yield, response time, avoided delay, user assessment |
| Acceptability | Can the system operate within legal and ethical limits? | Consent basis, privacy review, governance approval, public trust |
A weighted score may be helpful when resources are limited, but a single total can conceal serious weaknesses. For example, strong timeliness should not compensate for unknown population coverage if the data are being used to compare regions. Agencies should retain the individual dimension scores and specify minimum thresholds for critical safeguards.
Test integration with existing surveillance channels
A new stream gains value when it can be interpreted alongside other evidence. Cross-channel comparison can reveal whether a rise in respiratory symptoms is also visible in laboratory testing, ambulance calls, school absence, or medication purchases. Agreement across independent systems increases confidence, while disagreement may reveal reporting gaps, changes in healthcare behavior, or a signal that requires targeted investigation.
Integration does not require every record to be linked at an individual level. In many settings, daily or weekly counts by location, age group, symptom category, or facility type are sufficient. Aggregated analysis can reduce privacy risk and simplify interoperability. Where individual-level linkage is necessary, agencies should define the minimum fields required and apply strict access controls.
Data standards are central to reliable integration. Terms such as “fever,” “respiratory complaint,” or “gastrointestinal illness” may be recorded differently across facilities. A shared vocabulary, stable geographic identifiers, timestamp conventions, and documented revisions help distinguish a true epidemiological change from a technical change.
Analysts should also examine dependencies between streams. Several sources may draw from the same clinical encounters, meaning apparent agreement is less informative than it seems. Conversely, independent channels may respond to different stages of illness and provide complementary lead times. Understanding these relationships supports better ensemble models and prevents double-counting evidence.
Validate performance during routine and unusual events
Historical back-testing is a useful starting point, but it cannot answer every operational question. Agencies should test the candidate stream against previous outbreaks, seasonal peaks, reporting disruptions, and periods with no major disease activity. Evaluation should measure how often the system detected meaningful events, how early it produced a signal, and how much investigative work was generated by false alarms.
Prospective pilot monitoring provides a stronger test of usability. During a pilot, analysts can assess data delivery, dashboard performance, alert thresholds, communication routines, and the time required to explain anomalies. Users from local health offices, hospitals, laboratories, schools, and emergency services should participate because the value of an alert depends on how quickly the receiving organization can act.
Scenario exercises are especially important for rare or high-consequence events. A simulated cluster may test whether the system can identify an unusual geographic pattern, distinguish deliberate contamination from ordinary illness, and share information through appropriate channels. Resources discussing bioterrorism early warning can inform scenario design, while actual response decisions should remain grounded in verified evidence and established emergency protocols.
Performance should be stratified rather than reported only as an average. A stream may work well in urban hospitals but poorly in rural clinics, or provide timely information for children while missing older adults in residential care. Stratification by region, age, facility type, season, and event intensity exposes these differences and supports targeted improvements.
Build governance around responsible use
A surveillance data stream operates within legal, ethical, and social boundaries. Governance should specify why information is collected, who may access it, how long it is retained, and what uses are prohibited. These decisions should be documented before deployment, particularly when data could reveal sensitive health conditions or affect specific communities.
Privacy protection is compatible with effective early warning when the system is designed around necessity and proportionality. Aggregation, pseudonymization, role-based access, secure transfer, and controlled disclosure can reduce risks. Public communication should explain the purpose of monitoring, the kinds of information used, and the safeguards applied, using language that avoids implying individual diagnosis from a population-level signal.
Quality management must continue after implementation. New clinical software, changes in reimbursement, altered pharmacy purchasing patterns, school calendar differences, and public concern about a particular illness can all modify the baseline. A review process should track these changes, investigate unexpected shifts, and record when definitions or thresholds are revised.
Evaluation findings should be visible to decision-makers in a form that supports action. Technical reports can contain detailed methods, while operational summaries should show the signal, its confidence, its limitations, and the recommended next step. Clear uncertainty is more useful than a falsely precise alert.
Choose streams that improve response
The best source is not necessarily the largest or most technologically advanced. It is the one that fills a recognized information gap and improves a specific decision. A modest school absenteeism feed may provide earlier insight into pediatric transmission than a complex national dataset. A pharmacy channel may extend coverage to people who never enter a clinic. Ambulance data may reveal severity before diagnosis codes are available.
Before adoption, agencies should estimate the full operating cost. This includes data agreements, technical infrastructure, analyst time, training, validation, privacy review, maintenance, and communication. A stream that produces frequent alerts without sufficient capacity to investigate them can weaken confidence in the entire surveillance program.
Practical safeguards for implementation include:
- Define the intended use, target population, alert horizon, and response owner before deployment.
- Set minimum standards for timeliness, completeness, coverage, privacy, and system availability.
- Run a pilot across contrasting regions and facility types rather than testing in a single setting.
- Compare signals with established channels and document explanations for disagreement.
- Review thresholds, data quality, and public-health value at scheduled intervals and after major system changes.
When evidence shows that a stream adds meaningful lead time or coverage, it can be incorporated into routine monitoring with clear escalation rules. If it fails to provide dependable value, the evaluation should explain why and identify whether the problem lies in the data source, the processing method, or the intended use.
Public-health teams can apply this framework to assess prospective feeds, strengthen Japan’s multi-channel surveillance approach, and prepare for enhanced monitoring during major international events. Start by defining the decision, measure the stream against transparent criteria, and connect promising signals to a response process that is fast, lawful, and evidence-based.