





Understanding Time Lags in Syndromic and Laboratory Data
Public-health teams rarely receive a complete picture of an outbreak at a single moment. Different surveillance channels record different stages of illness, and each has its own delay between a person becoming sick, seeking care, being tested, and appearing in an official dataset. Understanding these time lags is essential for interpreting epidemiological trends accurately.
Syndromic surveillance is designed to provide an early signal. It uses symptoms, clinical impressions, healthcare activity, absences, medicine purchases, and other indicators before a disease has been confirmed through laboratory testing. Laboratory-confirmed data usually offers greater diagnostic specificity, but it often arrives later because testing, reporting, and data validation take time.
The difference between these information streams does not make one inherently better than the other. They answer different operational questions. Syndromic indicators can show that unusual illness activity may be developing, while laboratory results help identify the pathogen, measure confirmed cases, and refine the response.
Why Surveillance Data Arrives at Different Speeds
The first delay occurs between infection and recognizable symptoms. Some people remain asymptomatic, while others develop signs within hours or several days. A person may then wait before seeking care, visit a pharmacy instead of a clinic, or stay home and miss school or work. These behaviors create a variable interval before an event becomes visible to a surveillance system.
Once someone enters the healthcare system, the reporting process introduces additional delays. A clinic may record a symptom-based diagnosis immediately, whereas a specimen may need to be collected, transported, processed, and reported. Hospitals and public-health authorities may then review the result before publishing it. Weekends, holidays, staffing levels, and changes in testing demand can lengthen this pathway.
Syndromic surveillance therefore captures illness-related activity closer to the point of first contact. Its signals may include fever, respiratory symptoms, gastrointestinal complaints, influenza-like illness, ambulance dispatches, or increases in purchases of relevant medicines. Laboratory surveillance generally follows later, when a suspected condition has been tested and classified with greater precision.
What Each Data Stream Can Tell Public Health Teams
Syndromic data is particularly useful for detecting departures from an expected baseline. A sudden rise in fever-related consultations, school absenteeism, emergency transport, or pharmacy sales may indicate that transmission or healthcare demand is increasing. These signals are often broad, so they cannot by themselves distinguish influenza from another respiratory infection or identify a specific pathogen.
Laboratory-confirmed data provides a stronger basis for case definition and attribution. Positive test results can reveal whether an observed syndrome is associated with influenza, norovirus, COVID-19, measles, or another infection. Test positivity, sequencing, and pathogen-specific counts also support decisions about isolation guidance, vaccination policy, clinical treatment, and targeted risk communication.
The most useful approach combines both forms of evidence. A symptom signal can prompt closer examination of laboratory results, while a rise in confirmed infections can help explain why syndromic indicators are changing. Guidance on data use helps place these streams within a wider framework for interpreting public-health information and supporting timely action.
Time lags also affect how trends should be described. A syndromic increase may represent current healthcare demand, while laboratory-confirmed cases may reflect infections that occurred several days earlier. Comparing the two as if they measured the same point in the outbreak can create the false impression that one dataset is inaccurate.
Reading the Delay Between Early Signals and Confirmation
A practical way to understand surveillance timing is to map the sequence of events. Infection occurs first, followed by symptom onset, care-seeking, clinical recording, specimen collection, laboratory processing, reporting, and data publication. The total interval can vary by disease, age group, healthcare setting, test type, and local reporting arrangements.
The table below shows a simplified comparison. These intervals are illustrative rather than fixed. They should be estimated from the actual reporting process and continuously reviewed when conditions change.
| Surveillance stage | Typical information captured | Relative speed | Main limitation |
|---|---|---|---|
| Symptom onset | Illness in the community | Earliest | Many cases are not observed |
| School or workplace absence | Missed attendance linked to illness | Early | Cause may be unclear |
| Pharmacy activity | Purchases of symptom-related medicines | Early | Sales are influenced by behavior and stock |
| Clinic or emergency visit | Symptoms and provisional diagnoses | Early to moderate | Access and care-seeking affect volume |
| Ambulance or hospital activity | Severe or urgent illness | Moderate | Misses mild cases |
| Specimen collection | Suspected infection undergoing testing | Moderate | Depends on testing practice |
| Laboratory confirmation | Identified pathogen or confirmed case | Later | Processing and reporting delays |
| Validated public release | Reviewed official statistics | Latest | Revisions can continue after publication |
A lag is not automatically a flaw. It is a feature of the measurement process. Analysts should ask what date each observation represents: the date of symptom onset, consultation, specimen collection, test result, notification, or publication. Mixing these reference dates can distort the apparent timing of a peak.
Data revisions are another important consideration. Recent laboratory counts may be incomplete because tests are still being processed or reports have not arrived. Later updates can make a past week appear larger than it did in the first release. Syndromic datasets may also be revised when participating facilities submit late records or correct coding errors.
How Japan’s Multi-Channel Approach Reduces Blind Spots
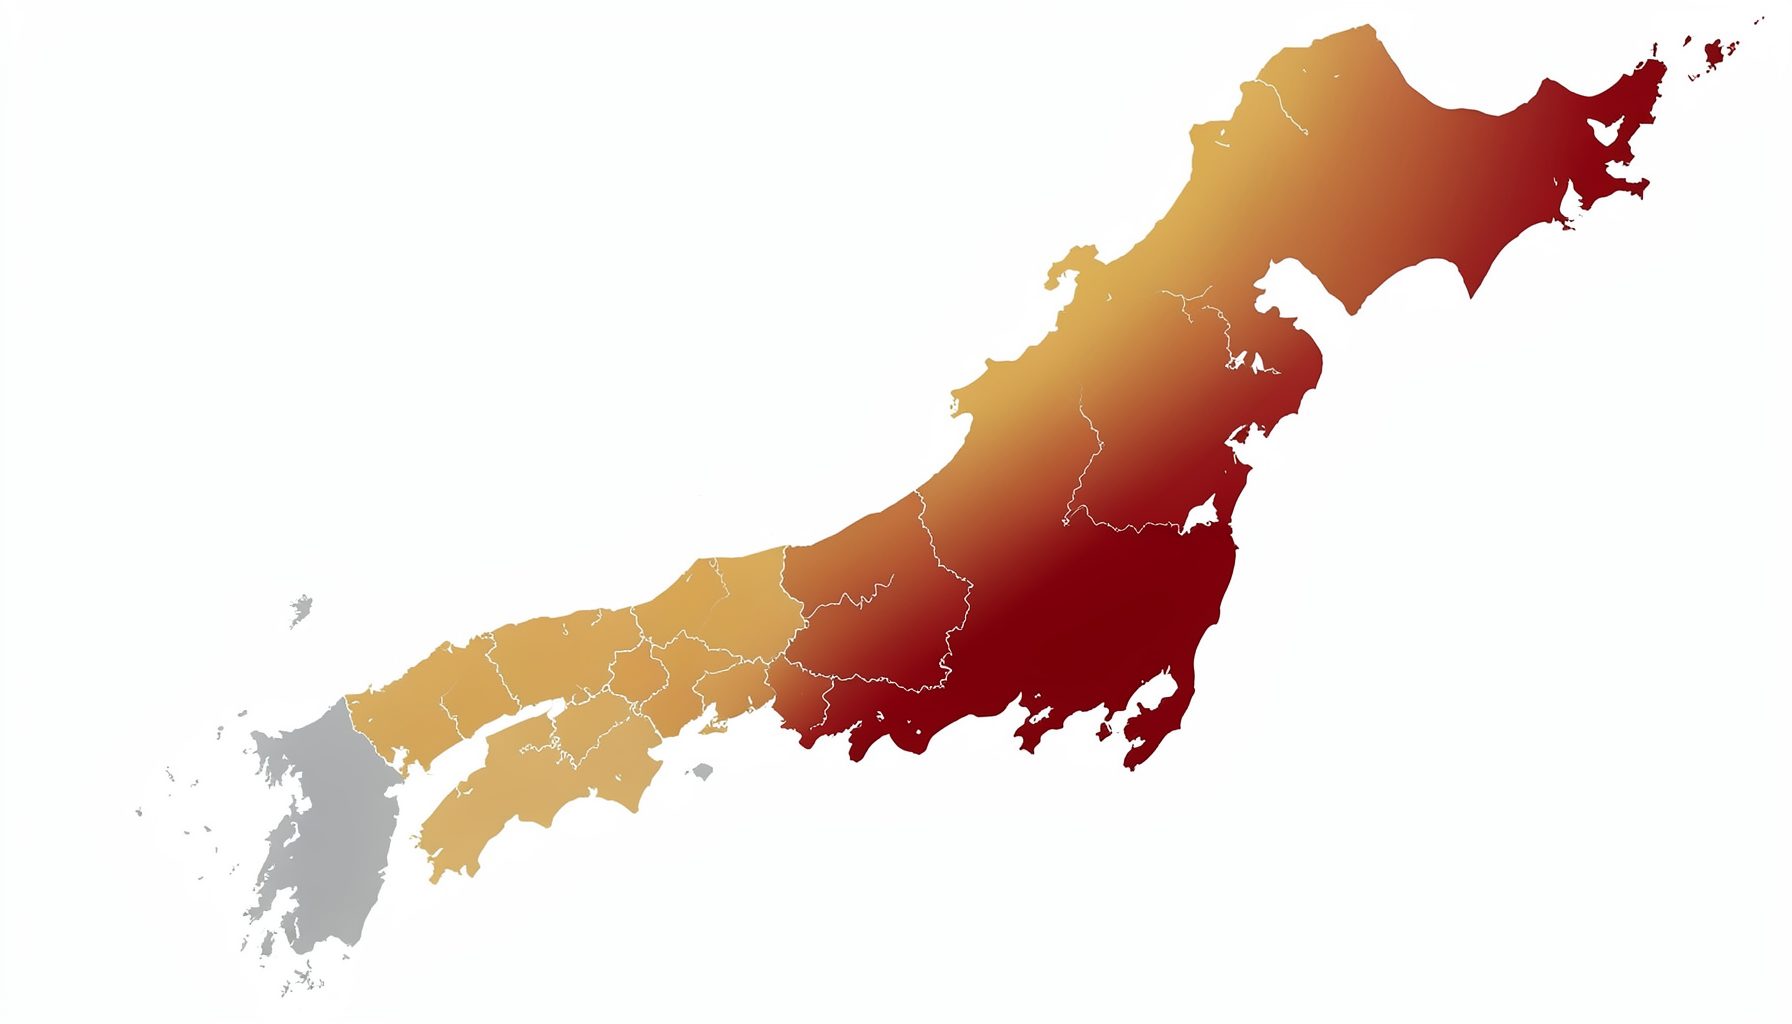
Japan’s surveillance environment illustrates why multiple channels matter. Information from clinics and hospitals can be examined alongside ambulance activity, pharmacies, schools, elderly-care facilities, and laboratory testing. Each source observes a different part of the illness pathway, allowing public-health teams to compare early community signals with clinical severity and confirmed diagnoses.
School absenteeism can be valuable when children are affected before a substantial increase appears in hospital data. Pharmacy surveillance may reveal growing demand for fever reducers, cough remedies, or gastrointestinal medicines among people who never seek clinical care. Ambulance and hospital indicators can show whether illness is placing pressure on urgent and inpatient services.
This kind of architecture is described in the discussion of multi-channel monitoring, where independent streams are combined to strengthen early warning. The goal is not to make every signal identical. It is to use differences among channels to identify where an outbreak may be moving and which populations or services are being affected.
A multi-channel system also supports cross-checking. If pharmacy purchases rise while school absence and respiratory consultations remain stable, the change may reflect seasonal behavior, a product promotion, or supply disruption rather than widespread transmission. If several channels rise together, confidence in a genuine increase becomes stronger, especially when the timing and geography are consistent.
Interpreting Discordant Signals
Syndromic indicators and laboratory-confirmed counts will often diverge. A rise in symptoms with few positive tests may occur when testing is limited, when a non-target pathogen is circulating, or when the syndrome definition is intentionally broad. It can also reflect heightened public concern, which encourages more people to seek care for mild symptoms.
The reverse pattern is possible as well. Laboratory confirmations may increase while syndromic activity appears stable if testing expands, screening is introduced, or infections are detected among people without severe symptoms. A small number of confirmed cases can also represent a concentrated cluster that has not yet affected the wider population.
Analysts should examine positivity rates, testing volume, healthcare attendance, age groups, location, and reporting completeness before interpreting a mismatch. A rise in positive results accompanied by a fall in total tests does not necessarily indicate increasing transmission. Similarly, a rise in consultations may be less concerning if the proportion requiring admission remains unchanged.
The timing of the mismatch can provide useful evidence. If a syndromic signal rises first and laboratory confirmations follow after the expected testing delay, the two streams may be describing the same event. If the gap persists beyond that interval, analysts should investigate changes in behavior, clinical coding, test availability, or the mix of circulating pathogens.
Turning Early Signals Into Operational Decisions
The value of early surveillance lies in the decisions it enables before a laboratory picture is complete. Health authorities may increase staffing, review supplies, alert clinicians, intensify infection-control measures, or communicate prevention guidance when several early indicators point in the same direction. These actions can be proportionate and reversible while confirmation is pending.
Resource planning is especially sensitive to time lags. Emergency departments may experience rising demand before confirmed case reports show a corresponding increase. Pharmacies may see shortages of common medicines before hospitals report a change in admissions. An explanation of resource allocation shows how timely signals can inform the distribution of staff, supplies, and clinical capacity.
Decision thresholds should account for uncertainty. A single unusual value may justify investigation, but it rarely justifies a major intervention without supporting evidence. Stronger action may be appropriate when a signal is sustained, exceeds a seasonal baseline, appears across several channels, or affects vulnerable settings such as care homes.
During major international events, enhanced monitoring can provide additional protection because travel, crowding, and healthcare access patterns may change quickly. Event-based surveillance, rapid reporting, and closer review of unusual syndromes can shorten the time between detection and response, even when laboratory confirmation remains pending.
Practices For More Reliable Interpretation
Public-health organizations can make time-lag analysis more consistent by documenting how every indicator is generated and when it becomes available. A transparent reporting calendar helps users distinguish preliminary observations from finalized counts. It also prevents recent under-reporting from being mistaken for a genuine decline.
Useful practices include:
- Label each record by its reference date, such as symptom onset, consultation, specimen collection, or result notification.
- Estimate reporting delays separately for clinics, hospitals, laboratories, pharmacies, schools, and care facilities.
- Compare current values with seasonal baselines and recent testing volume rather than using raw counts alone.
- Monitor revisions to recent weeks and avoid treating incomplete periods as final.
- Combine several signals before escalating a response, while preserving rapid review of unusual or severe events.
Analysts should also communicate uncertainty plainly. A statement such as “early indicators are increasing, while confirmation data remains incomplete” is more informative than presenting a precise-looking count without explaining its delay. Clear wording helps decision-makers act promptly without overstating what the evidence can prove.
The strongest systems learn from each event. After an outbreak, teams can compare the first syndromic alert with later laboratory results, measure the actual interval between signals, and identify which channels provided the clearest information. These evaluations improve thresholds, dashboards, staffing plans, and communication procedures for the next incident.
Early indicators are most valuable when they are interpreted as part of a sequence rather than viewed in isolation. Syndromic surveillance can reveal that something is changing, while laboratory confirmation can clarify what is changing and how widely it has spread. Tracking both timelines allows public-health teams to respond sooner and refine their actions as evidence becomes more specific.
Explore the available surveillance resources, examine how different channels relate to one another, and use time-lag information when assessing emerging disease activity. A careful reading of preliminary signals today can support faster, better targeted outbreak response tomorrow.