





Reading Influenza-Associated Pneumonia Patterns Through Syndromic Surveillance
Influenza can produce a broad range of clinical presentations, from uncomplicated fever and cough to severe lower-respiratory disease requiring hospitalization. Pneumonia associated with influenza may emerge gradually across communities, making it difficult to recognize through laboratory confirmation alone. Syndromic surveillance helps public-health teams detect that change earlier by tracking patterns in symptoms, healthcare use, and other routine signals.
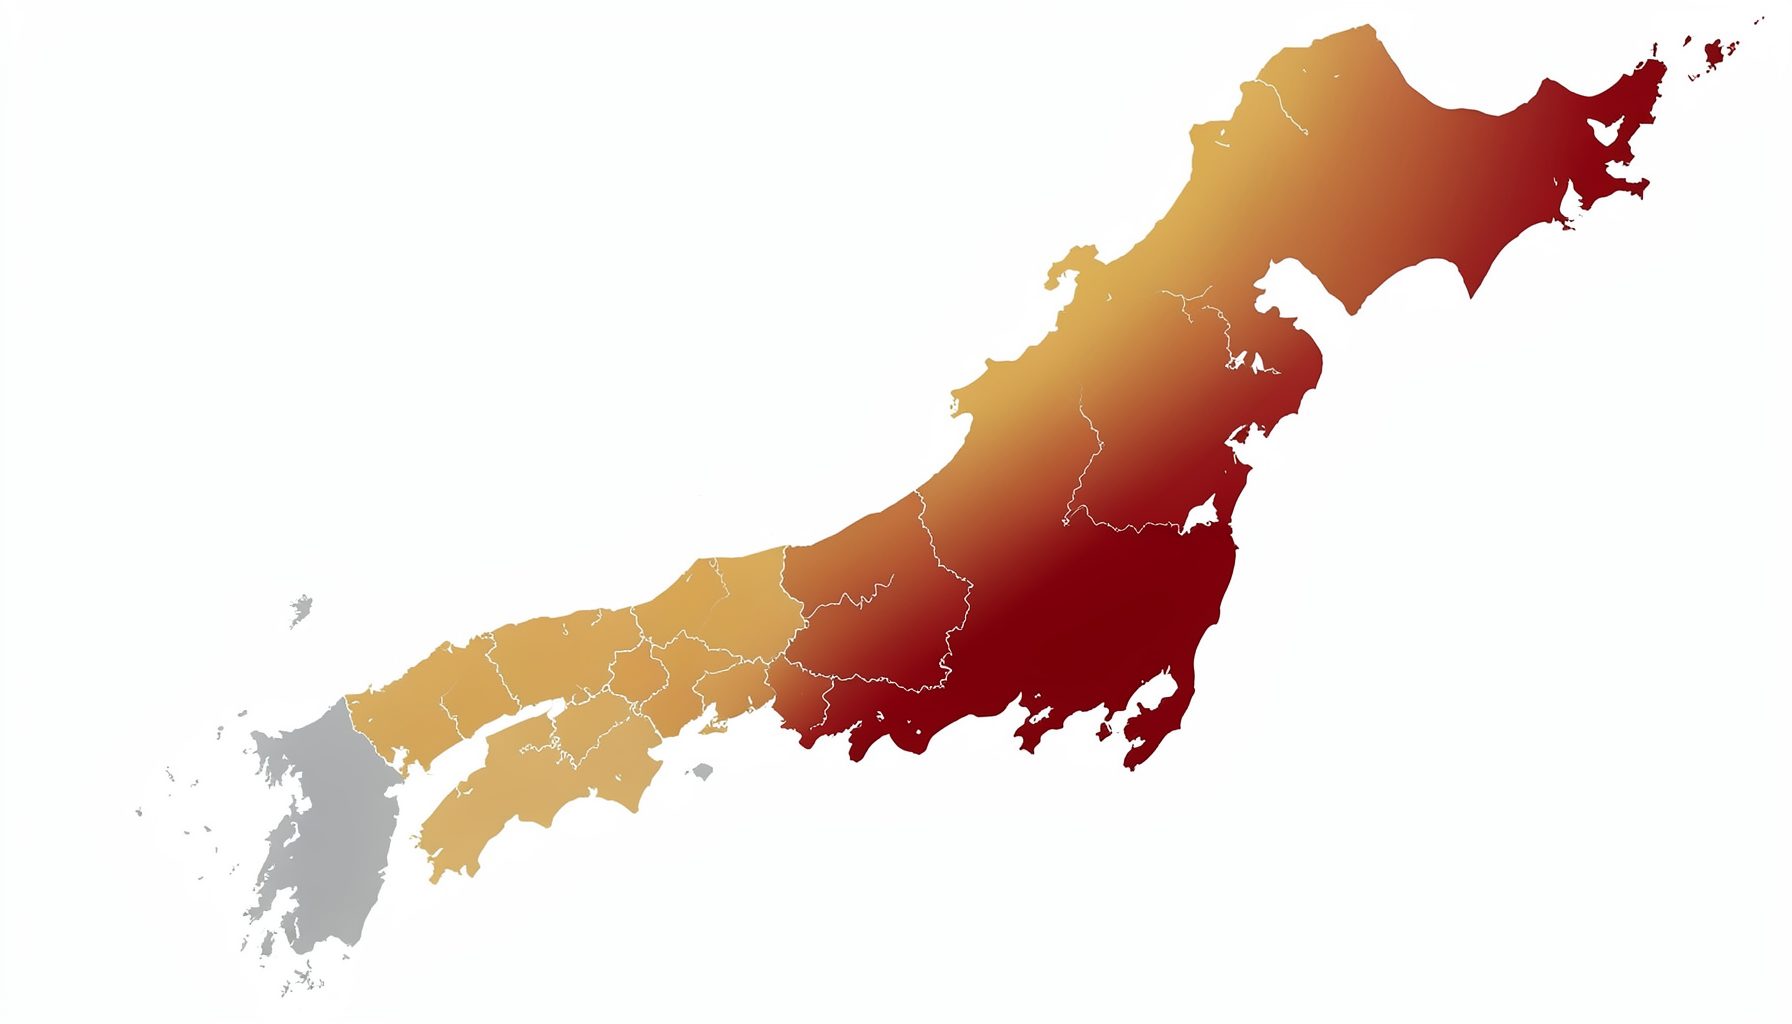
The approach focuses on what is happening before a definitive diagnosis is available. A rise in visits for fever, respiratory symptoms, hypoxia, pneumonia-like illness, or influenza-like illness can indicate increased transmission, especially when several independent data streams move in the same direction. Japan’s multi-channel monitoring model provides a useful framework because it connects information from clinics, hospitals, ambulances, pharmacies, schools, elderly-care facilities, and laboratories.
Pneumonia-related signals require careful interpretation. They may reflect influenza, another respiratory virus, bacterial co-infection, environmental exposure, or changes in healthcare-seeking behavior. The value of syndromic surveillance lies in identifying an unusual pattern quickly, then supporting it with targeted investigation and laboratory testing.
Why Pneumonia Patterns Matter Early
Influenza-associated pneumonia is an important marker of severity. During a typical seasonal wave, many people may experience mild upper-respiratory symptoms, while a smaller proportion develop viral pneumonia, secondary bacterial pneumonia, or exacerbations of chronic cardiopulmonary disease. A sudden increase in pneumonia-coded visits or respiratory admissions can therefore reveal that an outbreak is affecting vulnerable groups more heavily than expected.
The signal may appear in different settings at different times. Primary-care clinics can show an early rise in fever and cough. Emergency departments may then record more breathing difficulty, oxygen treatment, or suspected pneumonia. Ambulance dispatches and inpatient admissions can indicate escalation, particularly among older adults and people with chronic conditions.
Syndromic surveillance does not need to wait for every patient to receive a laboratory diagnosis. Instead, it uses combinations of symptoms, provisional diagnoses, care pathways, and changes from a seasonal baseline. This makes it valuable when testing capacity is limited, reporting is delayed, or a novel strain is circulating before its full clinical profile is understood.
Signals Used To Identify Respiratory Escalation
A strong influenza-related pneumonia signal usually consists of several indicators rather than a single count. Emergency visits for respiratory distress, hospital admissions for pneumonia, ambulance calls involving fever and dyspnea, and pharmacy purchases of antipyretics or cough medicines may collectively suggest growing transmission. Each source has a different level of specificity and delay.
Clinical terminology also affects the signal. Providers may record “influenza-like illness,” “acute respiratory infection,” “viral pneumonia,” or “community-acquired pneumonia” depending on the patient’s age, symptoms, local coding habits, and available tests. Monitoring systems should therefore group related terms while preserving distinctions between mild outpatient illness and severe lower-respiratory disease.
Age distribution is another important dimension. A rise among school-aged children may precede wider household transmission, while an increase among nursing-home residents may indicate a concentrated and potentially severe outbreak. Comparing age groups, locations, and care settings can help distinguish broad community spread from a localized institutional cluster.
Combining Community And Clinical Data
No single surveillance channel provides a complete picture. School absenteeism can reflect influenza transmission among children before many families seek medical care, while pharmacy data may capture people who self-treat without visiting a clinic. Hospital and ambulance data are less sensitive to mild infections but are more informative about severity. Laboratory reports provide confirmation, though they often arrive after the initial increase in illness.
Japan’s integrated approach is designed to connect these perspectives. A respiratory signal detected in clinics becomes more credible when pharmacies, schools, and hospitals show related movement. If school absences rise while pediatric consultations and antipyretic purchases increase, public-health officials may investigate influenza transmission even before testing confirms a widespread outbreak. Resources on school absenteeism data are particularly relevant because educational settings can provide an early view of community respiratory activity.
The timing of each source must be considered. Pharmacy sales may change rapidly but can be influenced by stockpiling. Hospital admissions may be more stable but lag behind symptom onset. School reports can be affected by holidays, examinations, weather, and attendance policies. Combining sources reduces the risk that one distorted or incomplete indicator will drive an inappropriate response.
| Surveillance signal | What it may reveal | Main limitation | Useful interpretation |
|---|---|---|---|
| Influenza-like illness visits | Community respiratory transmission | Symptoms overlap with many viruses | Compare with seasonal baselines and test positivity |
| Pneumonia consultations | Possible increase in lower-respiratory disease | Coding practices vary by facility | Examine age, geography, and admission rates |
| Hospital admissions | Clinical severity and healthcare burden | Usually delayed relative to onset | Track trends by age and comorbidity |
| Ambulance dispatches | Acute deterioration and severe disease | Sensitive to access and dispatch policy | Look for geographic clusters and respiratory complaints |
| Pharmacy purchases | Self-treated illness and medicine demand | Affected by stock, promotions, and behavior | Use with clinical and laboratory indicators |
| School absenteeism | Early transmission among children | Influenced by calendars and attendance rules | Compare with pediatric and household signals |
| Laboratory positivity | Etiological confirmation | Reporting and testing delays | Validate and refine syndromic alerts |
Distinguishing Influenza From Other Causes
Influenza-associated pneumonia cannot be identified reliably from symptoms alone. Fever, cough, fatigue, shortness of breath, and chest discomfort can also occur with respiratory syncytial virus, COVID-19, adenovirus, bacterial infections, and mixed infections. Seasonal timing may raise or lower suspicion, but it should not replace diagnostic evaluation.
The most useful method is triangulation. A rise in influenza-like illness accompanied by increased influenza test positivity is more persuasive than a rise in respiratory complaints alone. If pneumonia admissions increase but influenza positivity remains low, officials should assess other pathogens, air pollution, heat or cold stress, and changes in referral or admission practices.
Clinical severity markers add further context. Oxygen saturation, respiratory rate, intensive-care admission, mechanical ventilation, and in-hospital mortality can show whether a wave is producing unusually severe disease. These data should be interpreted alongside vaccination coverage, circulating strains, antiviral availability, and the age and health status of affected patients.
Digital activity can also produce misleading changes in apparent public interest. Analysts should separate health-related signals from unrelated online traffic, such as Belgian payment betting, which may create attention spikes without any connection to respiratory illness. Data provenance and source relevance are essential when automated systems combine many feeds.
Establishing Baselines And Alert Thresholds
An alert requires a reference point. Public-health teams can compare current observations with historical data from the same weeks in previous years, adjusted for population size, reporting coverage, holidays, and known seasonal variation. A simple count may look alarming in a growing city but represent a normal pattern after accounting for population and service use.
Thresholds can be statistical, operational, or both. A statistical threshold may flag values above an expected range, while an operational threshold may trigger review when pneumonia admissions exceed a level that threatens hospital capacity. The best systems allow graduated responses: routine monitoring, epidemiological review, field investigation, and public-health action.
Short-term anomalies should not automatically be treated as outbreaks. A cold snap can increase respiratory visits, a media report can change testing behavior, and a medicine shortage can shift patients between pharmacies and clinics. Analysts should examine persistence over several reporting periods and check whether neighboring areas show similar movement.
During major international events, enhanced monitoring may be appropriate. Large gatherings can increase travel, crowding, and demand for emergency services, while visitors may use healthcare facilities unfamiliar with local reporting procedures. Temporary increases in syndromic reporting, laboratory testing, and event-based intelligence can improve the ability to identify imported infections or unusual clusters.
Turning Detection Into A Public-Health Response
Early detection matters only when it leads to proportionate action. A suspected increase in influenza-associated pneumonia may prompt verification with laboratories, review of hospital capacity, outreach to care homes, and reminders about vaccination, ventilation, hand hygiene, and staying home when ill. If severe illness is concentrated in a particular facility, infection-prevention teams can investigate rapidly.
Communication should reflect uncertainty without minimizing risk. Officials can explain that syndromic data indicate an unusual pattern rather than a confirmed cause. Clear updates should identify affected locations, groups at increased risk, available testing, and symptoms that require urgent medical attention, such as difficulty breathing, persistent chest pain, confusion, or bluish discoloration.
Recommendations for using respiratory surveillance data effectively:
- Combine outpatient, hospital, ambulance, pharmacy, school, and laboratory information rather than relying on one source.
- Track pneumonia indicators separately from general influenza-like illness to identify changes in severity.
- Stratify results by age, location, care setting, and underlying health risk.
- Investigate unusual signals with targeted laboratory testing and clinical record review.
- Document reporting delays, coding changes, holidays, and other factors that can distort trends.
A mature surveillance program also evaluates its own performance. After each influenza season, analysts can review which signals appeared earliest, which produced false alarms, and how quickly alerts led to verification or intervention. This feedback improves thresholds, data quality, and coordination between local authorities, healthcare providers, laboratories, schools, pharmacies, and emergency services.
Syndromic surveillance for influenza-associated pneumonia patterns is most effective as a bridge between the first signs of illness and confirmed epidemiological understanding. By connecting community behavior with clinical severity, it can reveal where transmission is increasing, who is at greatest risk, and whether health services are beginning to strain. Public-health teams should use these signals continuously, validate them promptly, and turn credible alerts into timely protection for communities.