




Reading Gastroenteritis Signals Through Pharmacy Sales
Gastroenteritis often spreads quietly before people present to a doctor or hospital. Many people first manage vomiting, diarrhoea and dehydration at home, buying oral rehydration solutions from a community pharmacy. A sudden rise in these purchases can therefore provide an early clue that more people are becoming unwell.
Pharmacy sales data do not diagnose infection and cannot identify a pathogen on their own. They show a change in community behaviour: households are seeking fluids, electrolytes and other products associated with gastrointestinal illness. When that change appears across several locations or matches other indicators, it can help public-health teams investigate an emerging outbreak sooner.
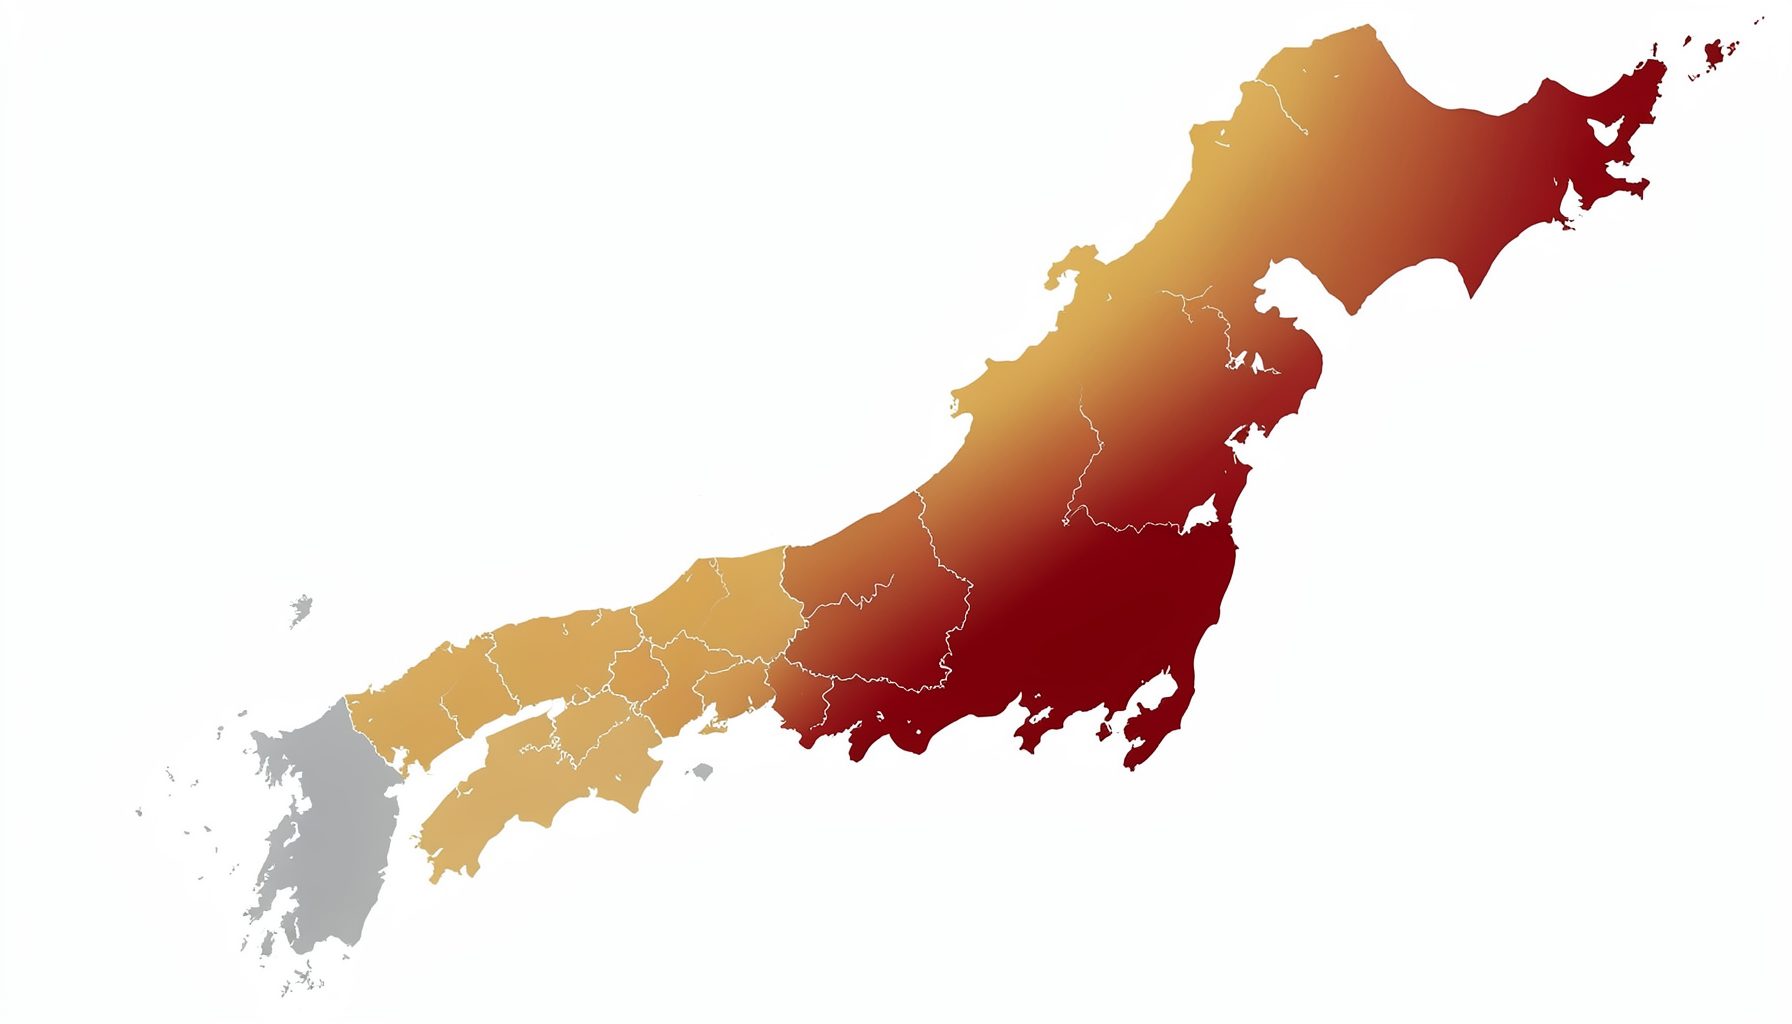
This approach fits within syndromic surveillance, which uses health-related signals before laboratory confirmation is complete. Japan’s multi-channel model illustrates the value of combining pharmacy information with clinic and hospital reports, ambulance activity, school absenteeism, elderly-care notifications and laboratory testing. The same principle can support faster situational awareness in Australia.
Why rehydration products can act as an early signal
Oral rehydration solutions contain water, salts and glucose in proportions designed to help replace fluids and electrolytes lost through diarrhoea or vomiting. They are commonly purchased when a family member becomes unwell, particularly when a person is not drinking normally or appears at risk of dehydration.
A pharmacy sales increase may occur before formal case counts rise. People can develop symptoms, ask a pharmacist for advice and purchase a rehydration product without contacting a general practitioner. This creates a useful behavioural signal that sits between household illness and the clinical health system.
The signal is especially relevant for outbreaks involving norovirus, rotavirus, bacterial food poisoning or other causes of acute gastroenteritis. It may also reflect heat stress, intense exercise or travel-related illness, so interpretation requires context rather than a simple assumption that every sale represents infection.
What pharmacy data can show
The most useful measure is usually a change from an established baseline. Analysts may compare current daily or weekly sales with the same period in previous years, adjusting for weekends, public holidays, seasonal demand and promotional activity. A sustained increase across several pharmacies is more informative than a single unusual transaction.
Geographic distribution can add detail. Sales concentrated around one suburb may point investigators towards a local event, aged-care facility, school or food premises. A broad rise across metropolitan Melbourne, Brisbane or Perth may suggest a wider community trend, although population movement and weather conditions must also be considered.
Products should be grouped carefully. Oral rehydration sachets, electrolyte drinks and paediatric rehydration products may have different consumer groups and uses. Data should also distinguish unit sales from revenue, because price changes or larger pack sizes can create a misleading impression of increased demand.
Reading the signal alongside other channels
Pharmacy activity becomes stronger evidence when it aligns with other syndromic indicators. Increased gastroenteritis consultations at emergency departments, ambulance call-outs for dehydration, school absences and reports from residential aged-care facilities can collectively show that illness is spreading.
Laboratory results remain essential for confirmation, but they often arrive after a person has become ill, sought care and provided a specimen. Syndromic data can identify where to look first, guide targeted sampling and help public-health teams decide whether health advice or infection-control measures need to be issued.
This multi-source approach is central to modern outbreak intelligence. For example, investigations into waterborne illness benefit from comparing gastrointestinal symptoms with environmental and laboratory findings; background on contaminated-water outbreaks shows why early, indirect signals can matter while confirmation is still developing.
Australian factors that shape pharmacy demand
Australia’s pharmacy market is varied. Independent pharmacies, Priceline stores, Chemist Warehouse outlets, supermarket aisles and online dispensaries may all sell products used for fluid replacement. A surveillance programme should define which outlets contribute data and account for differences in opening hours, stock availability, online ordering and local purchasing habits.
Geography also matters. A rise in sales in Sydney’s western suburbs may reflect a local school or household cluster, while activity in Cairns could be affected by tourism, seasonal conditions or travel. In regional and remote communities, a small number of pharmacies may serve a large area, making privacy protection and careful interpretation particularly important.
Australian routines can influence the baseline. Families may seek advice from a pharmacist after a child becomes ill, particularly outside general-practice hours. During summer heat in Adelaide or Perth, electrolyte products may sell more frequently for non-infectious reasons. Around public holidays, sporting tournaments and camping trips, temporary changes in demand can complicate outbreak detection.
Separating illness from ordinary purchasing patterns
A sales signal should be assessed against factors that can raise demand without an outbreak. Heatwaves, bushfire conditions, long-distance travel, endurance events and changes in product placement can all affect purchasing. A new supermarket promotion or a shortage of a competing brand may shift customers towards the products being monitored.
Age and product type can help refine interpretation. Paediatric sachets may suggest illness among children, while larger household packs may reflect family transmission or preparation for travel. These clues are suggestive rather than definitive, and analysts should avoid turning retail behaviour into an individual diagnosis.
Privacy is another consideration. Public-health agencies generally need aggregated counts, not names, addresses or identifiable transaction histories. Reporting by area and time period can provide useful surveillance while reducing the risk that a small community, pharmacy or household is identifiable.
Designing a practical surveillance workflow
A workable system begins with a clear case-related product definition, a consistent reporting interval and an agreed geographic unit. Pharmacies might submit daily or weekly counts of selected rehydration products, with notes about stockouts, major promotions and unusual local circumstances. Automated dashboards can flag departures from expected levels for review.
Thresholds should be flexible. A small increase at one outlet may be noise, whereas a moderate rise across multiple pharmacies, combined with increased school absenteeism, deserves attention. Analysts can use statistical alerts, moving averages and historical baselines, but every alert should be checked by an epidemiologist or public-health practitioner.
Communication with pharmacists improves data quality. Pharmacy staff can report unusual clusters of customers describing vomiting or diarrhoea, requests for advice about a particular institution, or difficulty obtaining supplies. Such observations should be aggregated and handled according to local privacy and governance requirements.
Using the information for faster response
An early pharmacy signal can support proportionate action. Public-health teams may review food-safety complaints, contact sentinel clinics, check school and aged-care notifications, or increase laboratory testing in the affected area. Advice about handwashing, staying home while symptomatic, safe food preparation and when to seek medical care can be prepared before case numbers peak.
The signal can also help direct resources. Emergency departments may anticipate higher demand for dehydration-related care, while pharmacies can review stock levels and provide consistent advice about oral rehydration. In remote areas, early warning may support discussions about transport, clinical staffing and access to safe drinking water.
Monitoring during major gatherings is especially valuable. Concerts, sporting competitions, festivals and international events can bring together large mobile populations, making conventional location-based surveillance harder. A dedicated event surveillance approach can combine pharmacy sales with emergency presentations, online reports and other rapid indicators.
Practical indicators for public-health teams
The value of pharmacy surveillance depends on comparing multiple signals rather than relying on one number. A useful review can consider:
- Change in oral rehydration product sales against the local baseline
- Number of pharmacies showing a similar increase
- Reports of vomiting or diarrhoea from schools, clinics and aged-care services
- Weather, travel, promotions, stock availability and major local events
A simple alert can then trigger a structured assessment. Teams can examine whether the rise is geographically concentrated, whether it affects children or adults, and whether clinical or laboratory data are moving in the same direction.
Before deployment, organisations should also define operational details:
- Which products and outlets are included
- How often data are transmitted and reviewed
- Who investigates an alert and records the outcome
- How privacy, retention and data-sharing rules are applied
These arrangements turn retail information into a repeatable public-health resource rather than an occasional anecdotal observation. Guidance on pharmacy surveillance provides useful context for understanding how this channel can fit within a broader monitoring system.
Limits and responsible interpretation
Sales data have several weaknesses. A person may buy rehydration products for a reason unrelated to gastroenteritis, while an ill person may use tap water, homemade fluids or products purchased from a shop that does not contribute data. A pharmacy may also run out of stock, close temporarily or change its reporting practices.
Coverage can be uneven. Customers may cross suburb or state borders, use online retailers, or buy supplies while travelling. Rural and remote communities may have fewer outlets, and small numbers can make trends unstable. These limitations should be documented rather than hidden behind a precise-looking chart.
The strongest interpretation comes from triangulation. Pharmacy sales can suggest that a community is experiencing more gastrointestinal illness, but they cannot establish causation, identify a pathogen or estimate the exact number of cases. Confirmation still depends on clinical assessment, epidemiological investigation and laboratory testing where appropriate.
Used carefully, however, the signal can shorten the time between the first household illnesses and an organised response. It offers a practical view of community need, especially when linked to Australia’s existing health, education, aged-care and laboratory reporting networks.
Public-health organisations, pharmacy groups and researchers can begin by mapping available sales data, setting a transparent baseline and testing alerts against historical outbreaks. Building trusted data-sharing arrangements now will make it easier to recognise unusual gastrointestinal activity early and respond with targeted, timely advice.