





Real-time outbreak signals from emergency triage notes
Monitoring hospital emergency department triage notes for words like fever and cough can create a real-time syndromic signal, but the words are only the beginning. A note may say “denies fever”, “productive cough overnight” or “cough for three days”. Treating each as identical would create noise. A useful system converts free text into syndrome-level trends, compares them with expected patterns and alerts public-health teams when a change warrants investigation.
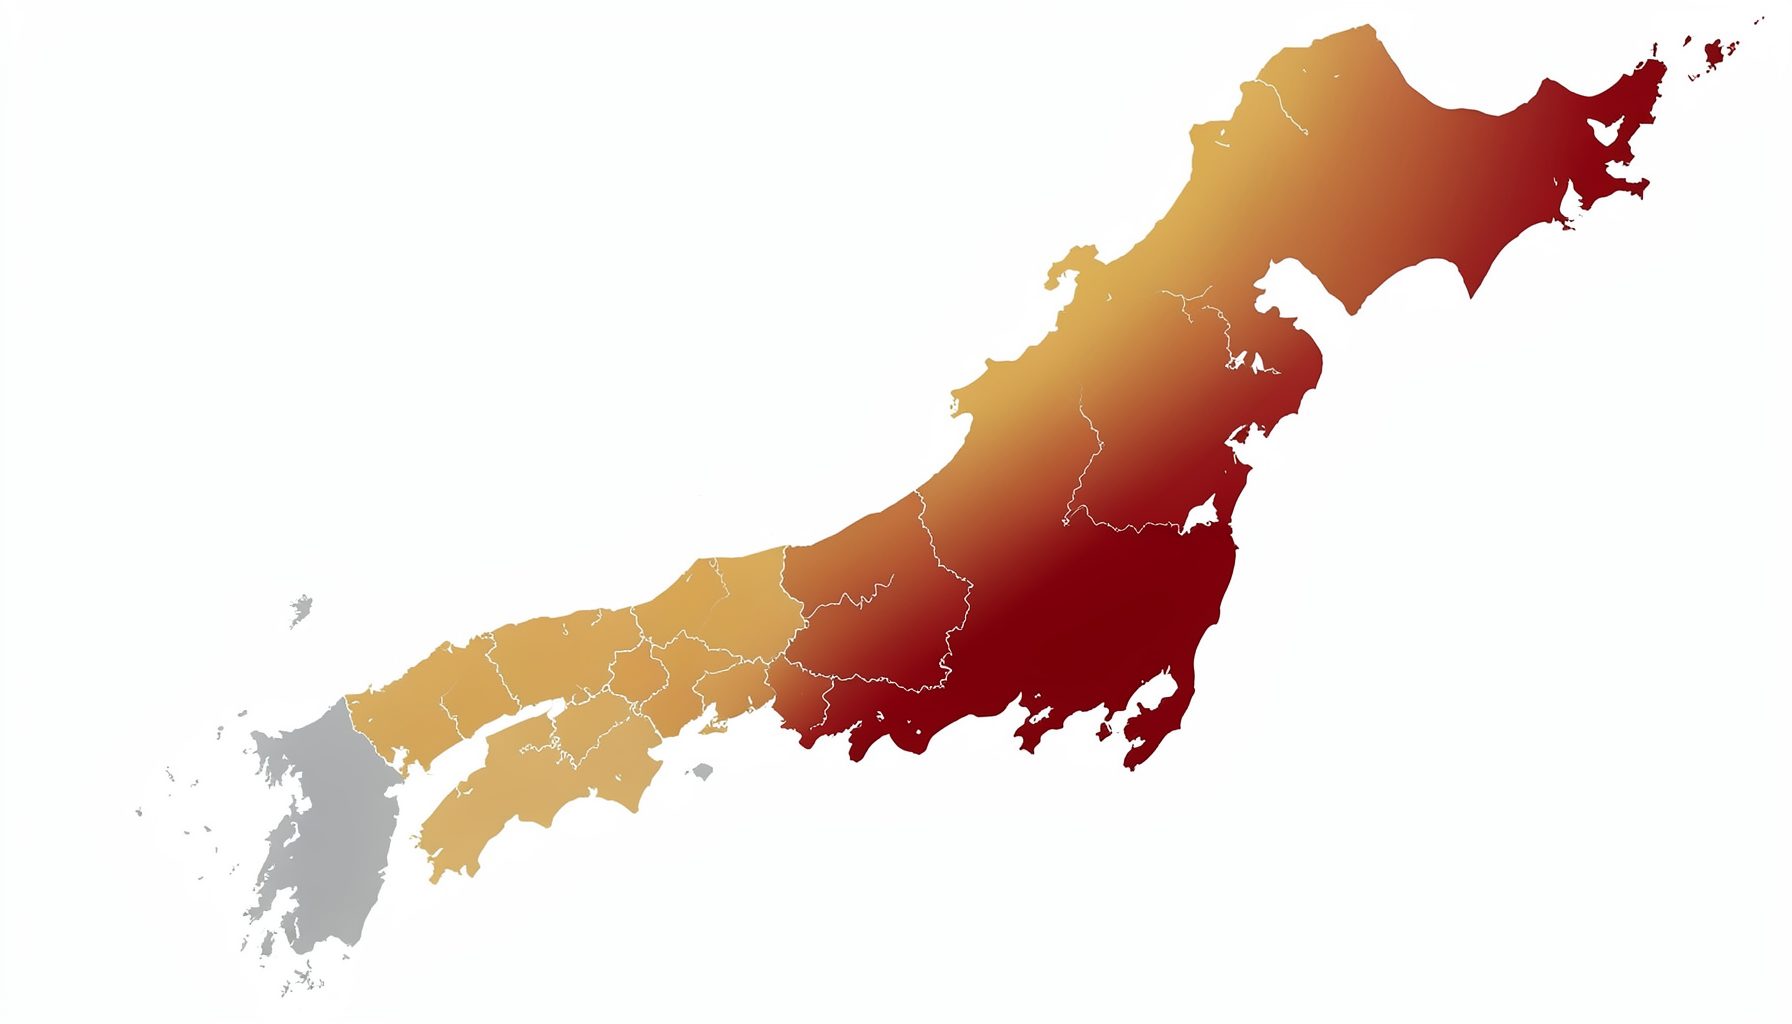
For Australia, this could complement laboratory testing and disease notification systems. Emergency departments in Melbourne, Sydney, Brisbane and Perth receive patients with respiratory and gastrointestinal illness every day, often after an after-hours GP visit or a trip to a pharmacy. Japan’s multi-channel surveillance model shows the value of linking clinical, ambulance, school, pharmacy and aged-care data.
The aim is earlier recognition, not an automated diagnosis from a note. Public-health teams need to know how quickly a signal appears, how often it is correct and whether it can support a proportionate response. That requires careful definitions, privacy controls, local baselines and a clear chain of action.
From clinical notes to analysable events
Triage notes are valuable because they are created before a final diagnosis is often available. Under the Australasian Triage Scale, they accompany an urgency assessment during the initial patient assessment, often within minutes of arrival. Their timing can reveal whether respiratory symptoms are increasing across a hospital catchment several days before laboratory results are filed.
A practical pipeline receives timestamped notes, removes direct identifiers, maps clinical phrases to syndromes and updates secure aggregates. Rules can catch explicit terms such as fever, cough, vomiting or rash. Statistical or machine-learning methods can detect patterns that fixed lists miss, while retaining links to the source record for authorised review.
“Real time” should be defined through operational targets rather than a slogan. Some systems update every hour, while others run short, scheduled batches overnight. The important measures are time from note entry to dashboard, time from signal to review and time from review to an appropriate public-health action.
Designing a reliable symptom vocabulary
A keyword is a clue, not a clinical event. “No fever”, “possible fever”, “history of asthma” and “family has influenza” should not be counted as current fever. The extraction layer needs negation, uncertainty, timing and attribution rules, with clinician review showing which phrases consistently perform well.
Syndromes should be broader than individual words. A respiratory syndrome might combine fever, cough, sore throat and breathing difficulty, while a gastrointestinal syndrome combines vomiting and diarrhoea. Counting each symptom separately supports different questions, but grouped syndromes often provide a clearer early warning for clusters.
Definitions belong in a versioned data dictionary that epidemiologists and analysts can inspect. Precise language prevents a surge in one hospital’s note-writing style from looking like a surge in disease. The value of clear definitions can be seen in a Blackjack rules explainer, where “hit” and “stand” work only within explicit rules. Surveillance terms need the same discipline.
Designing for the Australian health system
Australia’s health system is a mixed market of public hospitals, private hospitals, emergency departments, after-hours GP services, ambulance providers and pharmacies. A surveillance network must work across those settings without assuming one vendor or electronic record system. Standardising age bands, catchments and syndrome labels is often harder than installing software.
Everyday behaviour shapes the signal. A family in outer Sydney may call 000, attend a busy emergency department in the evening, ask an independent chemist for cough medicine or use a telehealth service before travelling hours to a hospital. In regional and remote Australia, temporary staffing, flights and a small number of facilities can produce sharp percentage swings from only a few cases.
A national dashboard also needs local views. Queensland, Western Australia and the Northern Territory face long travel distances and distinct disease patterns, while major cities face crowding and high patient turnover. Aboriginal communities should be involved in deciding how data about their health is collected, interpreted and governed, including through Aboriginal community-controlled health organisations.
Protecting privacy while preserving utility
The Privacy Act 1988 and the Australian Privacy Principles provide the national framework for handling personal information, including sensitive health information. State and territory privacy law, health-records legislation and public-health powers also apply. Each project should document its lawful authority, purpose and data-sharing arrangements rather than treating public-health value as permission by itself.
Good practice is to de-identify notes at the hospital boundary, keep re-identification keys under separate control, minimise free text in the central environment and suppress small cells that could reveal a patient. Role-based access, encryption, audit trails and retention limits reduce misuse. Only authorised analysts should be able to inspect source notes when a signal needs clinical context.
Automated extraction requires its own oversight. The public-health authority should publish the syndrome rules, monitor performance across demographic groups and hospital types, and investigate drift caused by new shorthand or changes in clinical practice. A multidisciplinary group can include clinicians, privacy officers, data engineers, epidemiologists, emergency-services representatives and community representatives.
Joining community-level signals
Emergency data should sit within a wider surveillance network. Ambulance dispatch and paramedic handover records may show earlier changes in demand, pharmacy data can capture purchases of fever or cough preparations, and aged-care facilities can signal clusters among residents who may not reach hospital. Each source has bias, so agreement across channels carries more weight than one unusual count.
Schools add another early view because absences rise quickly and can be aggregated safely. A dedicated school absentee monitoring resource explains how absence data can complement clinical reports. Absence is non-specific, but a simultaneous rise in schools, emergency departments and pharmacies is more actionable than any single trend.
This is the central lesson from Japan’s integrated system: combine information sources, preserve the time each observation arrives and let epidemiologists judge patterns across them. Major international events also alter travel, crowding and healthcare use, so temporary monitoring should compare event periods with appropriate local baselines rather than ordinary weeks.
Turning alerts into timely action
A signal needs a denominator. Hospitals count patients, not words, and a rise in fever mentions may reflect more notes, a new triage template or a respiratory season. Baselines should account for day and hour, public holidays, school terms, weather and local outbreaks. An alert should show the observed count, expected range, excess, geography, age profile and the data sources contributing to it.
When a threshold is crossed, a trained team should review the signal within a defined period, check data quality, compare clinical and community indicators and decide whether to seek specimens, contact facilities or issue advice. Every review should record what happened, including false alarms and signals that did not require escalation. Evaluation should emphasise timeliness, positive predictive value and workload, not simply the number of alerts generated.
A staged route to implementation
Begin with a governed pilot across a small, diverse group of hospitals, then establish the data dictionary before connecting feeds. Agree on syndrome definitions, timestamp rules, minimum cell sizes and escalation thresholds. Test the pipeline with historical and live notes, including negation, spelling variants and differences between metropolitan and regional facilities.
Build clinician and public-health review into the pilot from the start. Dashboards should show trends and data quality separately, while an authorised clinical review queue can retrieve the minimum source context needed to interpret an anomaly. Public-facing summaries should describe the method, uncertainty and purpose in plain language without identifying any patient.
Scale only after the pilot has demonstrated stable extraction, reliable alerting and a response pathway that works beyond the dashboard. Governance, maintenance and evaluation need funded owners, not just initial project funding. Expansion can then add pharmacies, schools, aged care and ambulance data while retaining common definitions and strict privacy controls.
Hospital triage notes can give Australian public-health teams a valuable early view of illness, but the signal depends on context, collaboration and restraint. A system that understands negations, learns local baselines and respects privacy is more useful than one that merely counts popular words. It should earn trust by producing timely, proportionate alerts and showing what happened after each review.
Establish a cross-sector pilot that brings emergency clinicians, laboratories, pharmacies, schools, aged-care providers and public-health analysts into one governed information network. Start with a few clearly defined syndromes, agree on privacy and response protocols, and measure the difference between early warning and routine confirmation. That partnership can turn real-time clinical text into faster, better-targeted action for the communities that need it.