





Using ambulance signals to spot pollen-related allergy clusters
Pollen season can create a rapid increase in breathing difficulty, wheezing, facial swelling and other allergic reactions. In Australia, these events may appear first in ambulance records, before hospitals have compiled emergency department data or public health teams have identified a clear pattern. Ambulance information can therefore act as an early warning signal for periods of unusual respiratory and allergic illness.
The signal is especially valuable when it is combined with other sources. Pharmacy purchases, school absences, general practice consultations, hospital presentations, weather conditions and pollen counts can help distinguish a genuine cluster from ordinary seasonal variation. A multi-channel syndromic surveillance system brings those observations together while laboratory confirmation is often unavailable or unnecessary for pollen-related illness.
Australian conditions make this work particularly relevant. Grass pollen can affect Melbourne and regional Victoria in spring, while Sydney, Canberra, Adelaide and Perth experience their own seasonal patterns shaped by vegetation, wind and rainfall. Thunderstorm asthma events can produce sudden surges in respiratory emergencies when storms interact with airborne pollen fragments.
Ambulance data also reflects everyday decisions and access to care. Some people use a reliever inhaler or buy antihistamines from a pharmacy, while others call Triple Zero (000) when symptoms escalate. Monitoring these different pathways can help health authorities issue timely warnings, prepare emergency services and target advice to communities facing a developing risk.
What ambulance records can reveal early
Ambulance services record information at several points: the initial call, dispatch, arrival at the scene, clinical assessment, treatment and transport. A surveillance feed might include an anonymised case identifier, time, broad location, age group, presenting complaint, respiratory observations, suspected anaphylaxis and whether the patient was taken to hospital.
The useful feature is speed. An increase in calls for wheezing, shortness of breath or allergic reaction in a defined area can be detected within hours. Analysts do not need to wait for a final diagnosis. Instead, they examine syndromic indicators, looking for a departure from the expected number of similar calls for that weekday, season, weather pattern and population.
The data must be interpreted carefully. A dispatch code can describe a concern rather than a confirmed condition, and a patient may have asthma, infection, anxiety or exposure to smoke rather than pollen allergy. Ambulance records are strongest as an alert mechanism: they identify where closer examination is needed, rather than proving that pollen caused every call.
Building a pollen-related syndrome definition
A practical case definition can combine words and codes associated with allergic reaction, asthma, bronchospasm, wheezing, breathing difficulty and anaphylaxis. It can also include treatments such as salbutamol, oxygen or adrenaline, provided analysts understand how consistently those treatments are recorded across the service.
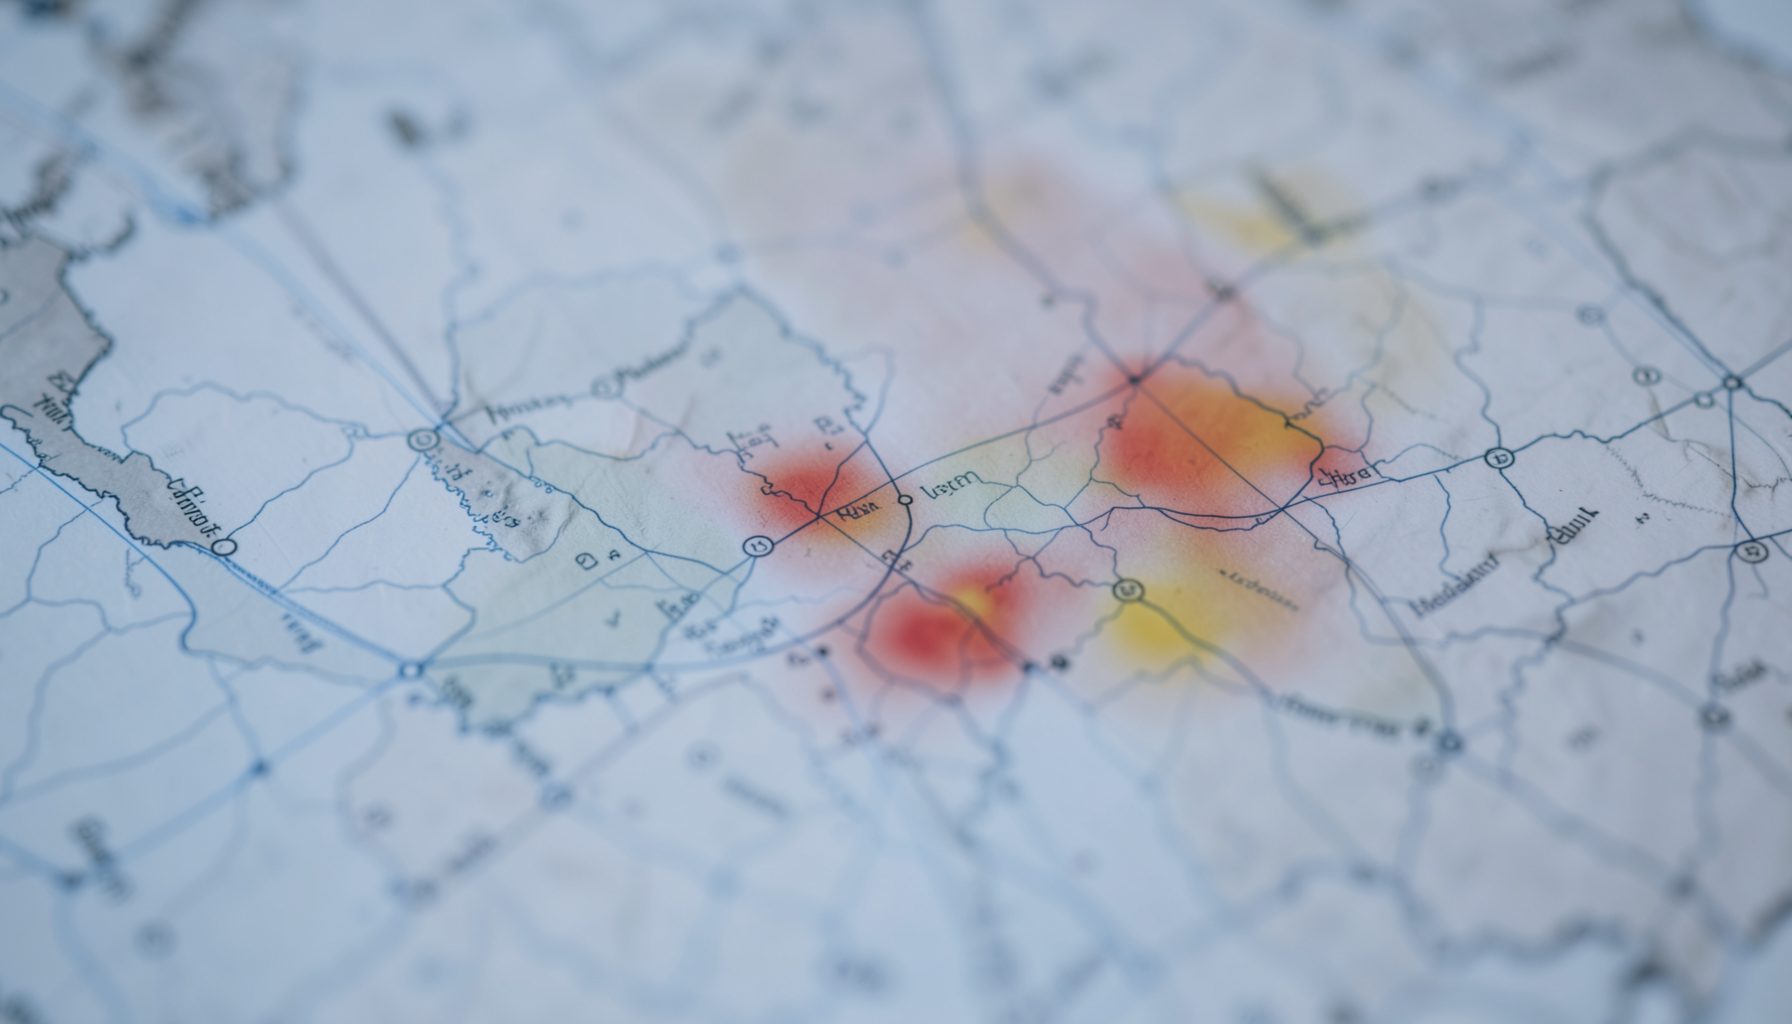
Location and timing add important detail. A cluster might mean an unusual concentration of calls within several suburbs, a rise among people near a sporting venue, or a sharp increase shortly after a high-pollen day. The best system compares current activity with historical baselines and separates genuine changes from routine weekend, holiday or event-related fluctuations.
Pollen-related illness should be analysed alongside alternative explanations. Smoke from bushfires, dust, mould, cleaning chemicals, food exposure and viral respiratory infections can produce overlapping symptoms. Weather data, air-quality alerts, pollen counts and local health reports help establish whether the ambulance signal fits the environmental story.
Linking ambulance signals with community data
Pharmacy surveillance can provide an earlier or broader view of mild symptoms. Increased sales or dispensing of non-prescription antihistamines, nasal sprays and asthma products may indicate that many people are managing symptoms at home. Australian pharmacy networks, including large discount chains and independent chemists, can contribute aggregated trends without exposing individual purchase histories.
School absenteeism is another useful companion measure, particularly when children experience asthma or hay fever during a high-pollen period. A sudden rise in absences across schools in Melbourne’s outer suburbs, for example, may support an ambulance signal, while a rise at one school could point to a local irritant or unrelated event. Aged-care facilities can supply additional information about respiratory symptoms among people at higher risk of serious outcomes.
Digital and public-facing signals require stronger quality controls. Search interest, online symptom reports and website traffic may change because of media coverage rather than illness. Analysts should remove unrelated activity and document how sources were selected; even Polkadot casino coverage can illustrate why web signals need careful classification when they are mixed with health-related traffic.
Detecting clusters without overstating risk
A monitoring team can calculate expected ambulance counts for small geographic areas and time periods, then flag sustained or statistically unusual increases. A moving average, historical percentile or control-chart method may be suitable, but the method should account for population size, service coverage, reporting delays and changes in ambulance dispatch practice.
Geographic analysis should protect privacy as well as identify risk. Broad suburbs, local government areas or postcode groups are generally safer for operational reporting than precise addresses. Small numbers should be suppressed or combined, especially in rural communities where a handful of cases could make individuals recognisable.
A useful alert includes context rather than a dramatic label. It might state that respiratory and allergic-reaction calls are above the five-year seasonal range in several neighbouring areas, coinciding with elevated grass pollen and strong winds. Public health staff can then review hospital data, contact local clinicians and decide whether a public message or operational response is warranted.
Responding to Australian seasonal realities
Australia’s pollen risks vary widely by region. Melbourne and parts of Victoria have experienced severe thunderstorm asthma episodes, while Canberra’s dry spring conditions can carry grass pollen across populated areas. Sydney’s mix of urban vegetation, coastal weather and traffic-related air pollution creates a different pattern, and Perth’s long warm season may extend exposure to several plant sources.
Local warnings should reflect how people live. Families may spend weekends at parks, community sports grounds and school ovals, while gardeners, outdoor workers and runners have frequent exposure. Advice can include checking pollen and air-quality forecasts, keeping prescribed inhalers accessible, limiting strenuous outdoor activity during high-risk periods and knowing when breathing difficulty requires urgent care.
Ambulance monitoring should also account for service demand. A major concert, agricultural show or sporting fixture can create a temporary concentration of calls without indicating a city-wide outbreak. Conversely, people in outer metropolitan areas or regional towns may face longer transport times and fewer nearby clinical services, so a modest rise in calls can have substantial operational importance.
Protecting privacy and making data useful
Ambulance information is sensitive health information. The federal Privacy Act 1988 and Australian Privacy Principles may apply, alongside state and territory requirements governing health records and public agencies. Victoria’s Health Records Act 2001 and New South Wales’ Health Records and Information Privacy Act 2002 are examples of local rules that may affect collection, linkage, access and disclosure.
A responsible surveillance program defines its purpose before receiving the data. It should use the minimum fields needed for detection, separate identifying information from analytical datasets, restrict access, record audit activity and establish retention periods. Data-sharing agreements should specify permitted uses, security controls, breach processes and responsibilities when a signal leads to public communication.
Transparency supports trust. Communities should be able to understand that ambulance data is being used in aggregated form to detect population-level risk, not to monitor named individuals. Reports should explain uncertainty, avoid stigmatising particular suburbs and distinguish a signal under investigation from a confirmed environmental cause.
Turning an alert into faster action
When an alert crosses a predefined threshold, an epidemiologist can review the underlying records and compare them with emergency department presentations, pharmacy activity, school absences, pollen observations and meteorological conditions. Ambulance clinicians and local health services can help identify changes in coding or treatment that may distort the apparent trend.
The response may involve a targeted warning, advice to schools and care facilities, additional ambulance readiness or a review of medication supplies. During a thunderstorm asthma risk period, timely public information about symptoms, reliever medication and emergency care can be especially important. Any message should be clear that severe breathing difficulty, collapse or signs of anaphylaxis require urgent medical attention.
Evaluation completes the cycle. Teams can measure how quickly the system detected the increase, whether alerts were clinically meaningful, how many false alarms occurred and whether communities received useful information. Regular review also helps adapt the syndrome definition to new dispatch software, changing pollen patterns and differences between state ambulance services.
Public health organisations developing this capability can contact the surveillance team to discuss data sources, alert design and responsible implementation. A well-designed system turns fast-moving ambulance information into practical situational awareness, helping Australian health services recognise pollen-related risk earlier and respond before demand reaches its peak.